

How To Run Statistical Tests In Excel
Let us start adding the add-in Analysis ToolPak to the Excel file.
Click File > Options > Add-Ins.
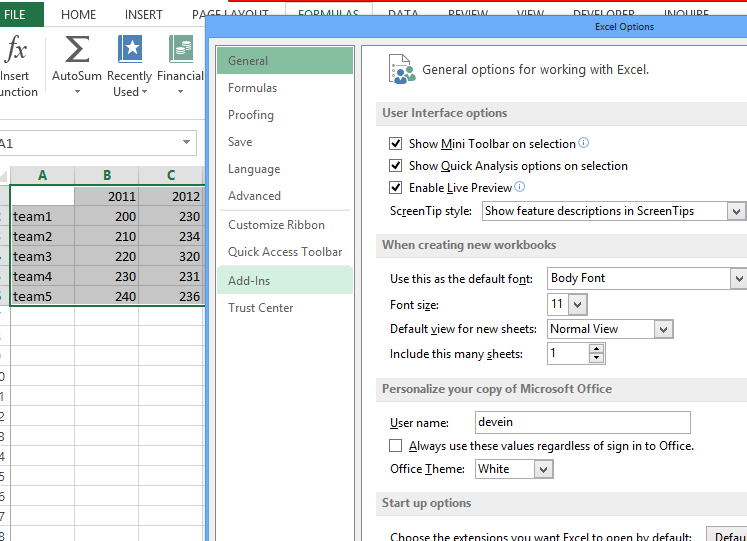
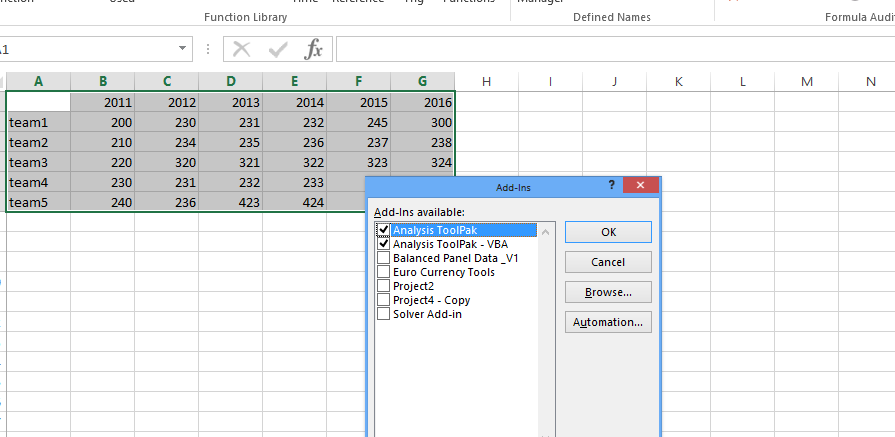
From the inactive add ins select the “Analysis toolpak” and from manage select Excel add in and click ok.
Then check these options.
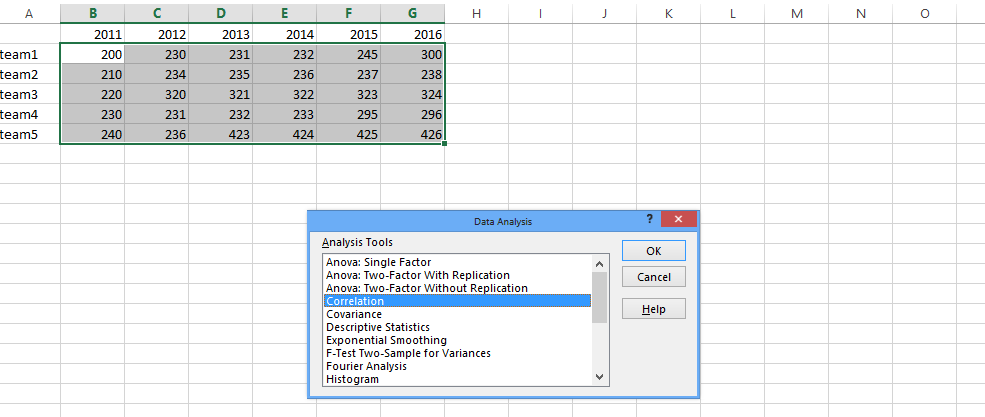
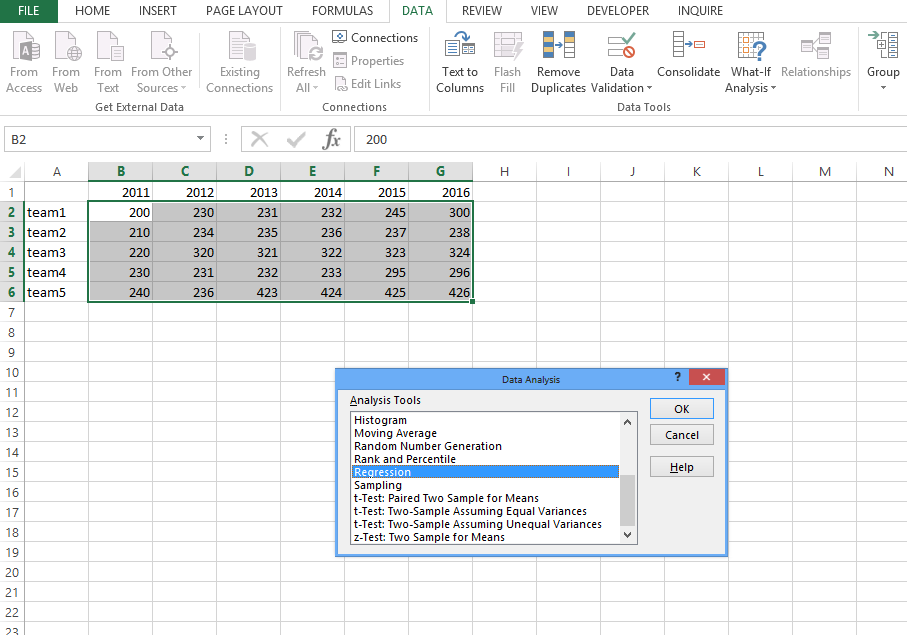
Now in the data > analysis > Data analysis will be visible which will be used for different types of statistical tests.
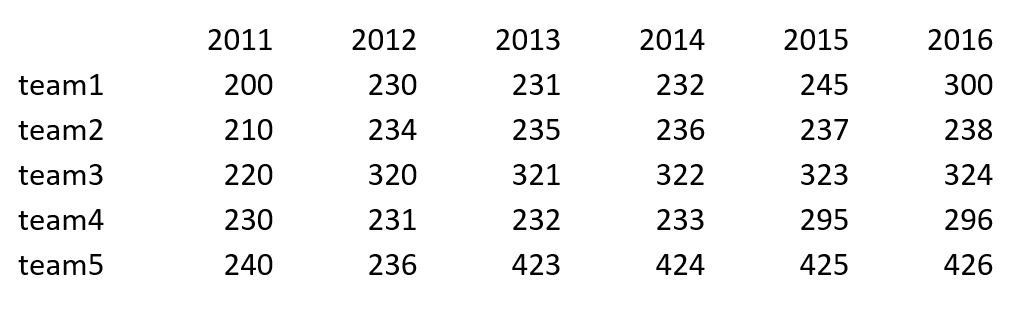
Let us create some simple data for analysis.
Select the data and start the analysis, correlation first.
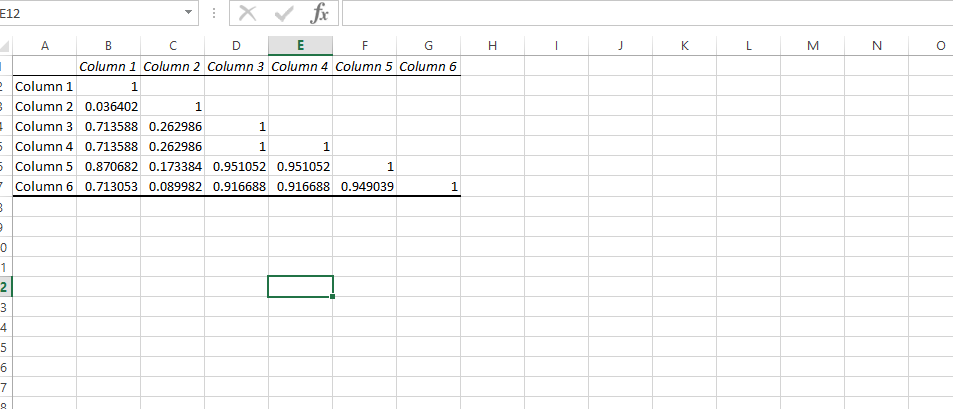
Results of correlation tests:
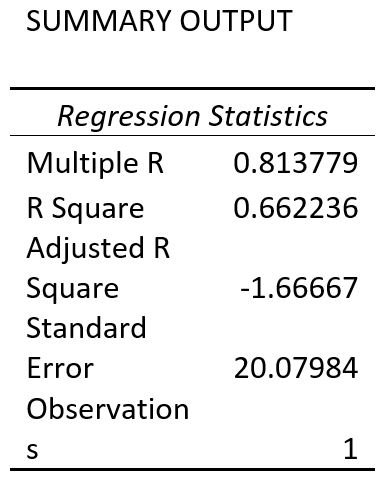
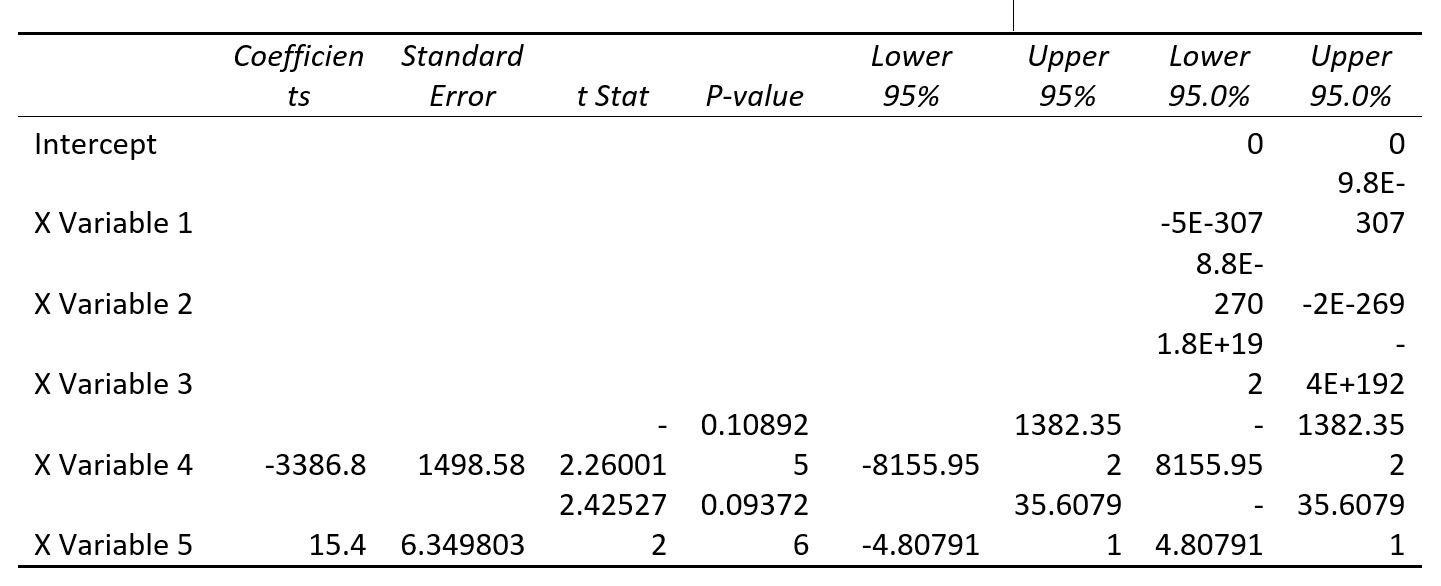
Let us run the Multiple Regression now:
Results look like this:
And more statistical tests available in descriptive statistics Excel tool.
Similarly we can perform all other analysis like: anova, histogram, moving average, Sampling, t-test etc as per the requirements.
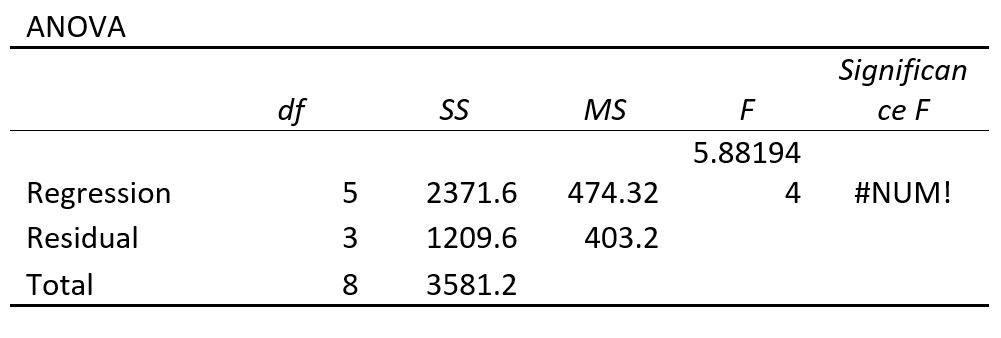
Anova statistical tests are ready as well.
Template
Further reading:
Basic concepts
Getting started with Excel
Cell References


