How to Calculate z-score in Excel
z = (x – μ) / σ
where:
- z is the z-score,
- x is the value to be standardized,
- μ is the mean of the given set of data,
- σ is the standard deviation of the given set of data.
Suppose you are a student and there are total 10 students in your class including you. After the final exam result is published, you want to know how well you performed compared to the average student’s mean score. You can find this easily using z-score.
Calculate z-score
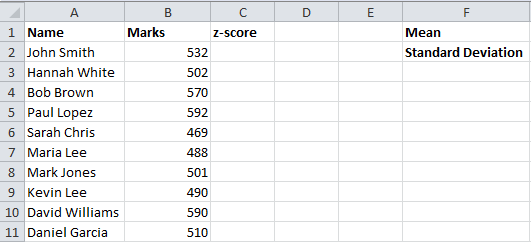
Open Excel and save your file as zscore.xlsx. Type “Name” in A1, “Marks” in B1, “z-score” in C1, “Mean” in F1 and “Standard Deviation” in F2. You should not enter the double quotes when you type in the data. You can format these cells and make them bold. Type ten different names in cells from A2 to A11 and type 10 different marks in cells from B2 to B11. Now your screen will look like this though the entries are different.
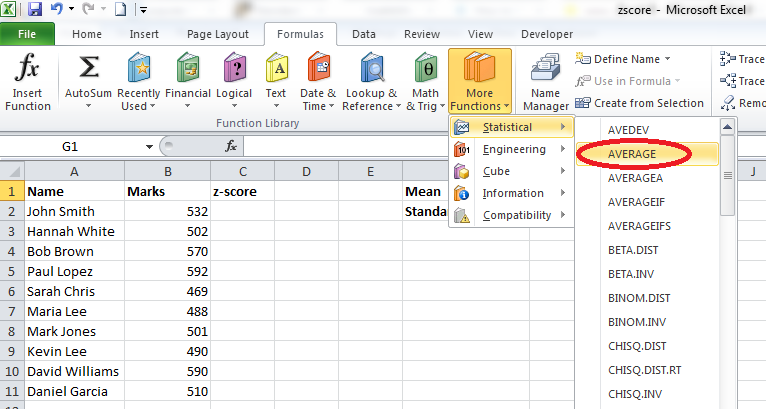
Click the cell G1 and go to Formulas (main menu) –> More Functions (in the Function Library group) –> Statistical and select the AVERAGE function.
You will get a screen like this:
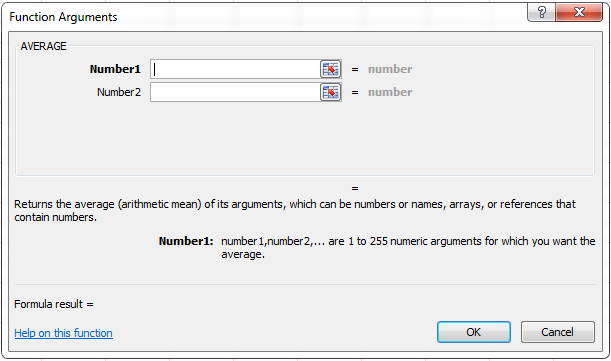
In the textbox Number1, enter B2:B11 and click OK.
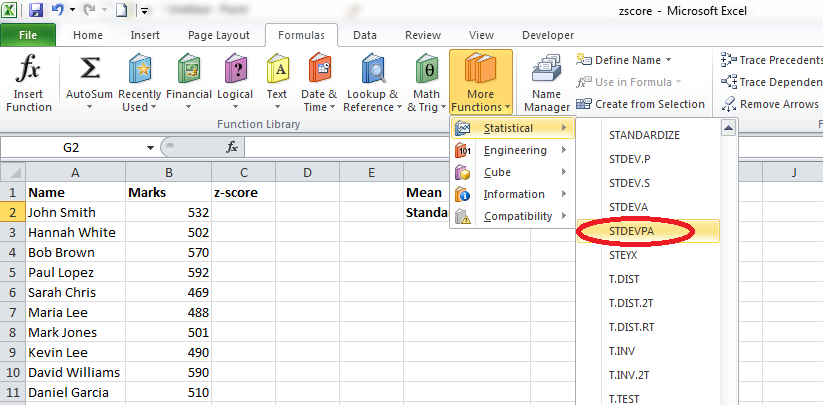
Click the cell G2 and go to Formulas (main menu) –> More Functions (in the Function Library group) –> Statistical and select the STDEVPA function.
You will get a screen like this:
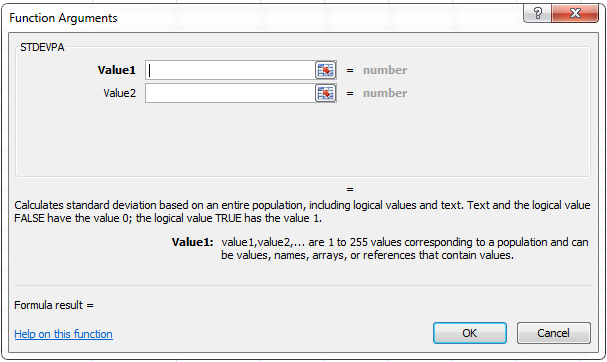
In the textbox Value1, enter B2:B11 and click OK.
Now your screen will look like this:
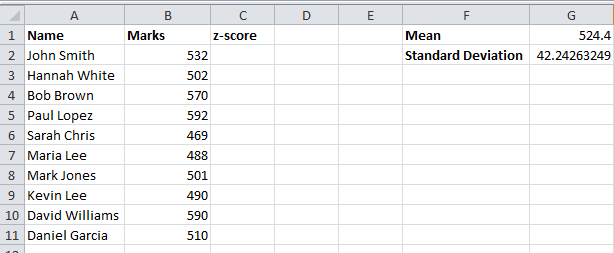
Click the cell C2 and go to Formulas (main menu) –> More Functions (in the Function Library group) –> Statistical and select the STANDARDIZE function.
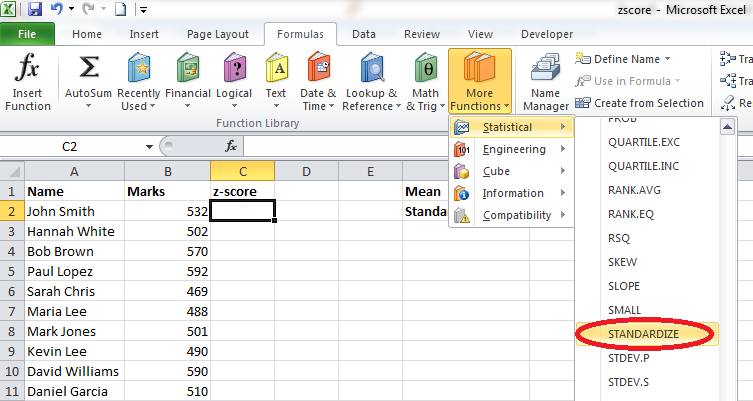
You will get a window like this:
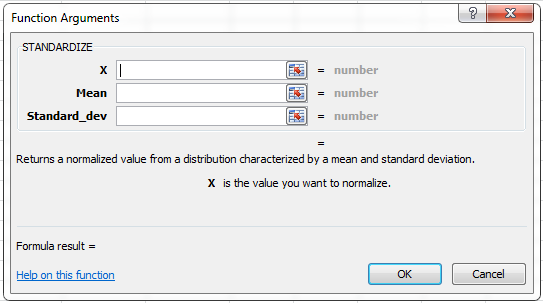
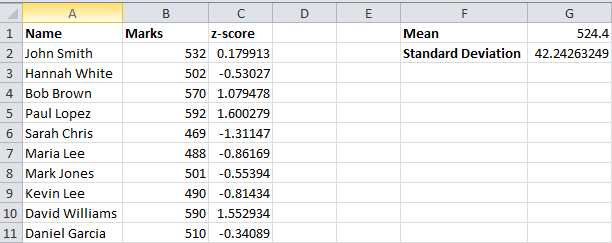
Enter “B2” in the X textbox, enter “$G$1” in the Mean textbox and “$G$2” in the Standard_dev textbox. Click OK and you will get a value in the cell C2. Copy the formula in cell C2 and paste the same in cells C3 to C11. Now your screen will look like this. Of course, the values would be different based on your entries.
Instead of using the STANDARDIZE function, you can directly enter the formula in the address bar like this:
![]()
In this case, we are using the formula to calculate the z-score directly instead of using the built-in STANDARDIZE function.
If you analyze the data, you could find that the highest z-score value is 1.600279 which is the z-score of Paul Lopez who scored the highest marks of 592. Sarah Chris has got the lowest z-score and obviously the lowest score in the exam.
You could find both positive and negative z-scores. Students who got scores more than the mean (value in cell G1) get positive z-scores and those who scored less than the mean get negative z-scores. If the z-score of a student is zero, it means that his or her score is same as the mean value. We can test this easily. Adjust the scores in such a way that one of the student’s score is same as the average. Make changes to the scores as shown in the following image:
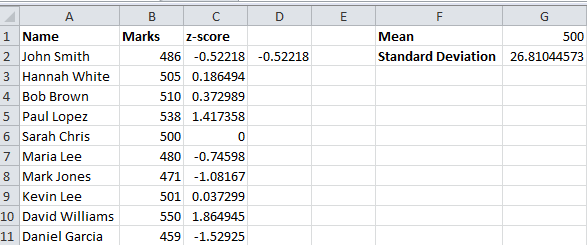
Here, you could find that the z-score of Sarah Chris is 0 because her score is same the average score. Students who scored more than 500 has got positive z-score and those who scored less than 500 has negative z-score.


