Combination Chart
A combination chart is a chart that combines two or more chart types in a single chart.
To create a combination chart, execute the following steps.
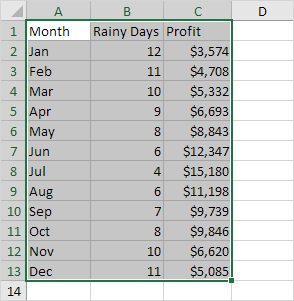
1. Select the range A1:C13.

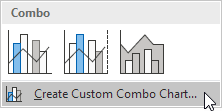
2. On the Insert tab, in the Charts group, click the Combo symbol.

3. Click Create Custom Combo Chart.

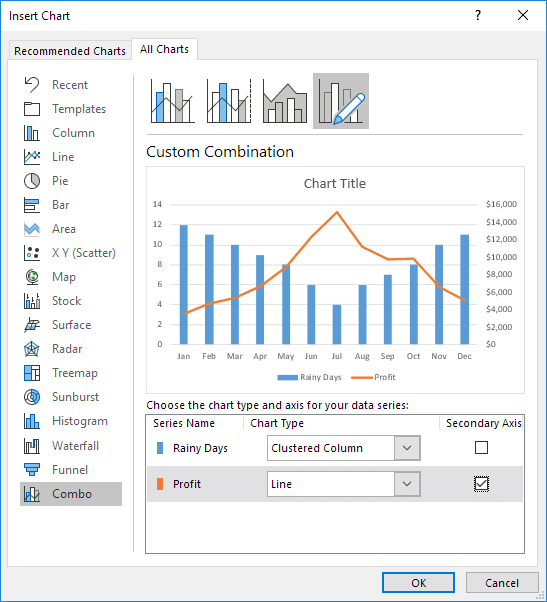
The Insert Chart dialog box appears.
4. For the Rainy Days series, choose Clustered Column as the chart type.
5. For the Profit series, choose Line as the chart type.
6. Plot the Profit series on the secondary axis.

7. Click OK.
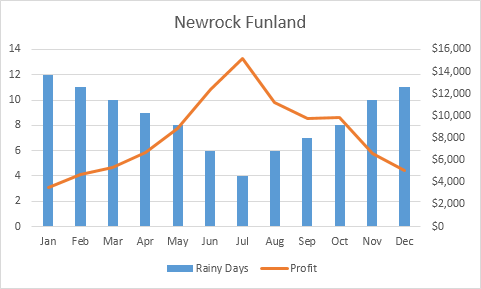
Result:

Next Chapter: Pivot Tables


