Correlation
The correlation coefficient (a value between -1 and +1) tells you how strongly two variables are related to each other. We can use the CORREL function or the Analysis Toolpak add-in in Excel to find the correlation coefficient between two variables.
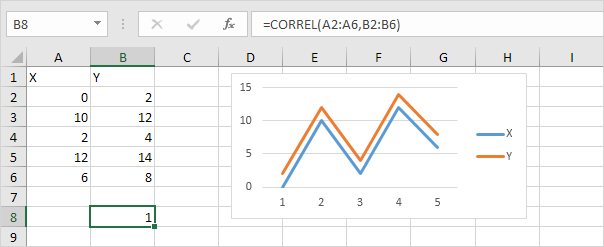
– A correlation coefficient of +1 indicates a perfect positive correlation. As variable X increases, variable Y increases. As variable X decreases, variable Y decreases.
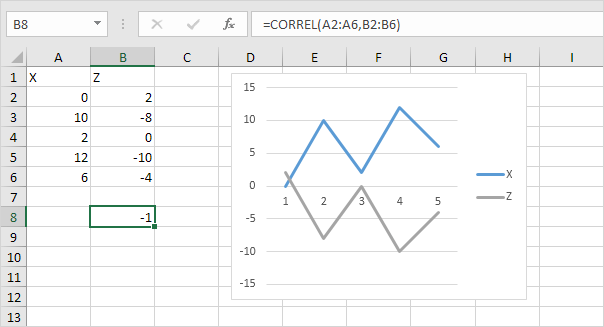
– A correlation coefficient of -1 indicates a perfect negative correlation. As variable X increases, variable Z decreases. As variable X decreases, variable Z increases.
– A correlation coefficient near 0 indicates no correlation.
To use the Analysis Toolpak add-in in Excel to quickly generate correlation coefficients between multiple variables, execute the following steps.
1. On the Data tab, in the Analysis group, click Data Analysis.

Note: can’t find the Data Analysis button? Click here to load the Analysis ToolPak add-in.
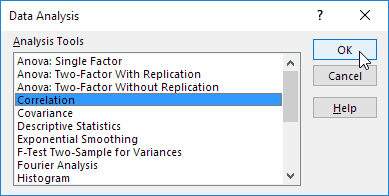
2. Select Correlation and click OK.
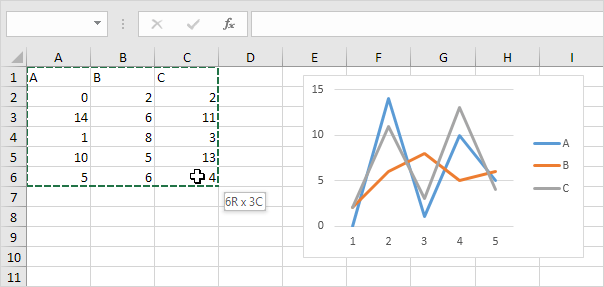
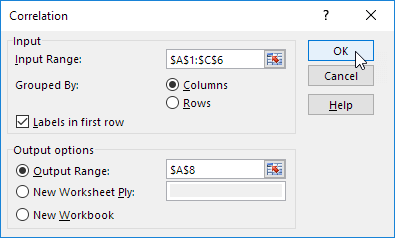
3. For example, select the range A1:C6 as the Input Range.
4. Check Labels in first row.
5. Select cell A8 as the Output Range.
6. Click OK.
Result.
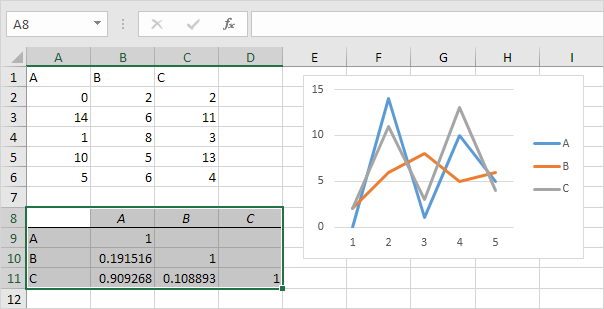
Conclusion: variables A and C are positively correlated (0.91). Variables A and B are not correlated (0.19). Variables B and C are also not correlated (0.11)
. You can verify these conclusions by looking at the graph.
Next Chapter: Create a Macro


