

Correlation in Excel
In MS Excel, correlation coefficient is calculated to find that how strongly two variables are related to each other. Correlation coefficient value is between 1 and -1. It basically measures the linear relationship between two variables and shows their relationship strength.
In this chapter, we will find the correlation coefficient for a set of Excel data using MS Excel software. It will help the Excel users to clear the concept of correlation and its usage.
How does correlation work?
A correlation coefficient 1 indicates to a positive correlation. It means if variable X increases, variable Y will also increase. Similarly, if variable X decreases, Y will also decrease.
In the same way, a correlation coefficient -1 refers to a negative correlation. As if variable X increases, variable Z will decrease. Similarly, if variable X decreases, Z will increase.
Correlation analysis
You can analyze the correlation between the variables and find it is a strong or weak correlation. We have a few real-life correlation examples for strong and weak correlation.
Strong Correlation
These are the examples for strong correlation, such as –
- Positive Correlation – Your weight and the number of calories you eat.
- Negative Correlation – Your heating bills and the temperature outside.
So, in both scenarios, both variables are strongly connected.
Weak Correlation
These are the examples for weak or no correlation, such as –
- Your pat dog and his favorite food.
- Your hair color and your height.
You can see that in both cases, variables have no relation or weak relation from each other.
Excel methods to find correlation
Excel enables two different ways to find the correlation coefficient between two variables. They both are totally different to each other and their process too.
- By using CORREL function
- Using Analysis ToolPak Add-in
Using CORREL function
CORREL() is a function available in Excel that helps to find the correlation coefficient between two variables or set of data. You can directly apply the CORREL function on Excel data and calculate the correlation coefficient between the variables.
Syntax
This function takes two array arguments, which is a range of data to find correlation.
Both are required parameters.
Example
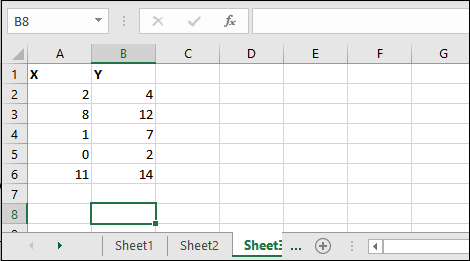
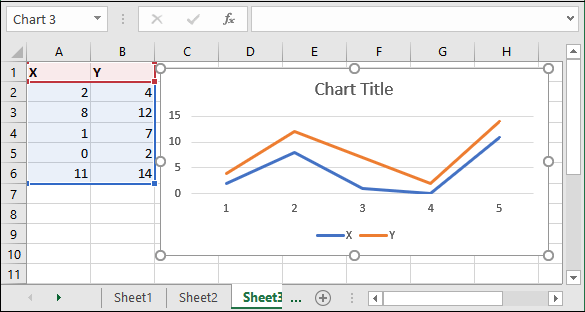
For example, we have a list of data in two columns (A and B) for which we will calculate the correlation coefficient.
Step 1: For this, select an empty cell to write the formula and enter this formula in it –
=CORREL(A2:A6, B2:B6)
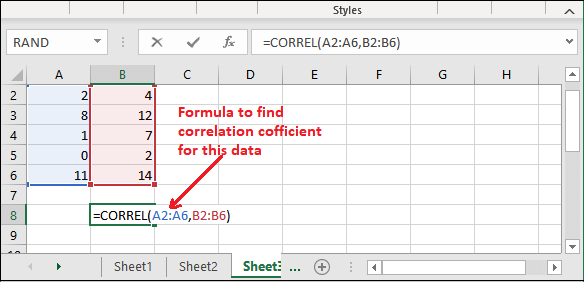
Here, A2:A6 and B2:B6 are the two variable lists whom we compare.
Step 2: Now, hit the Enter key to get the calculated correlation coefficient result and see the screenshot.
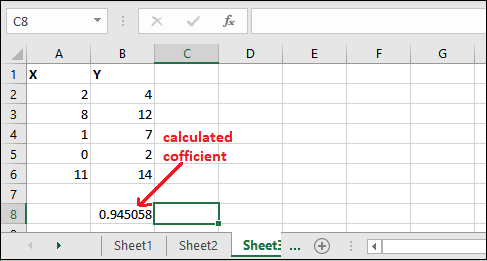
The calculated correlation is near to 1.
Step 3: Insert the line chart if you want to view the correlation coefficient visually.
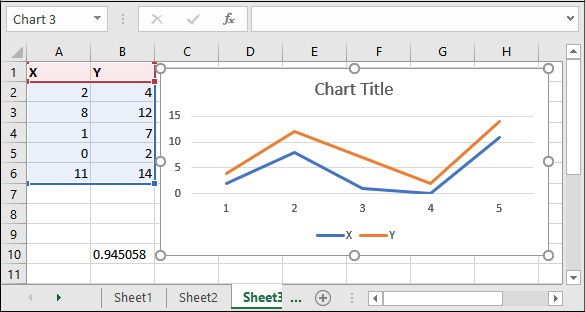
If the correlation is near to 0, it means that there is no correlation. But here, returned correlation result is near to 1. Hence, the variables are strongly connected.
Using Analysis ToolPak Add-in
In addition, there is one more way to find out the correlation coefficient. Analysis ToolPak allows the users to calculate the correlation coefficient between multiple variables. With the help of Analysis ToolPak Add-in, one can easily and quickly find the correlation coefficient.
To know how correlation coefficient is calculated, follow the given steps below:
Step 1: We have taken the following data, for which we will calculate the relationship between them by finding correlation coefficient.
Step 2: For this method, firstly you have to go Data tab where you find Data Analysis inside the Analysis group.
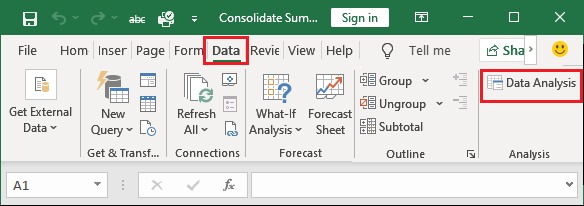
Step 3: Click the Data Analysis option here that will open a Data Analysis panel.

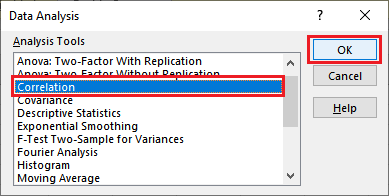
Step 4: Choose Correlation from the Analysis Tools list and click OK.
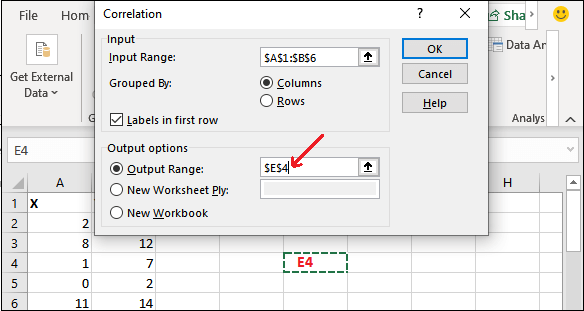
Step 5: A correlation panel will open like this –
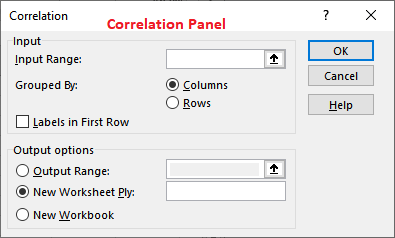
Step 6: In this panel, choose the following options –
- In this panel, click inside the Input Range field and select the data range between which you want to find a relationship.
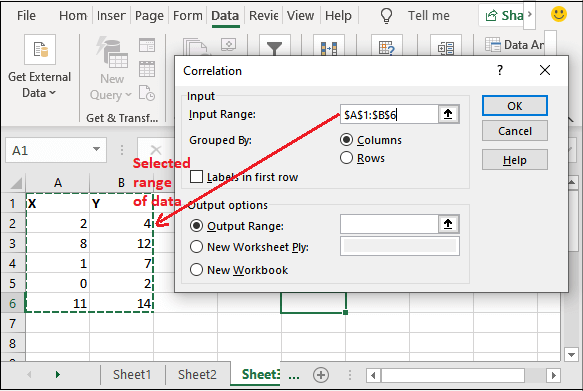

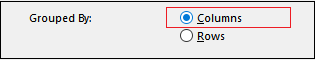
- Choose either Rows or Columns radio button for grouped by option. We have kept the default, i.e., Column radio button.
- Now, check the Labels in first row checkbox if your data contains labels.

- In the output options, select one of the radio buttons according to your data needs.
We have selected the Output Range and provided the cell reference where the output will place.
Step 7: When everything is set in this panel, click the OK button here.
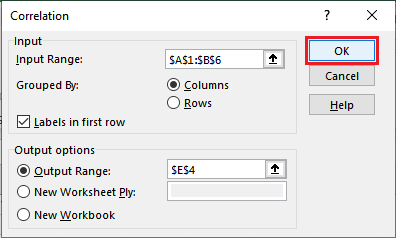
Step 8: The analysis range will display in the range you have specified above.
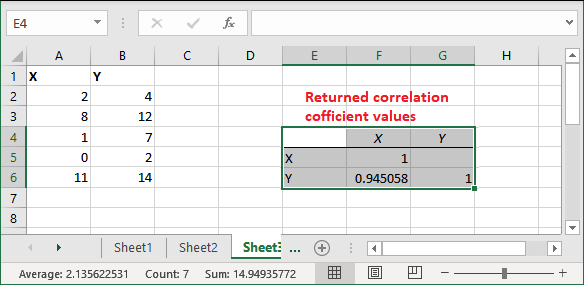
You can now insert the line chart to see the correlation coefficient analysis visually.
Analysis ToolPak Add-in is not available in Excel ribbon
If you do not find the Analysis ToolPak Add-in option anywhere in the Excel ribbon, this means it is not added there. You can manually add it as it is hidden yet. Analysis ToolPak is an advanced feature of Excel. So, it might be possible that it is not available in the Excel ribbon.
By default, it is not added in Excel when you download it. You have to explicitly add to the Excel. You can add the Analysis from the Add-ins. Follow the steps for it:
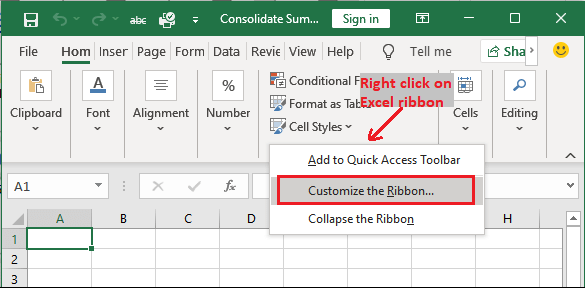
Step 1: Right-click on the Excel ribbon anywhere and select Customize the Ribbon from the list.
Step 2: Go to the Add-ins tab on the left side of this Excel Options panel.
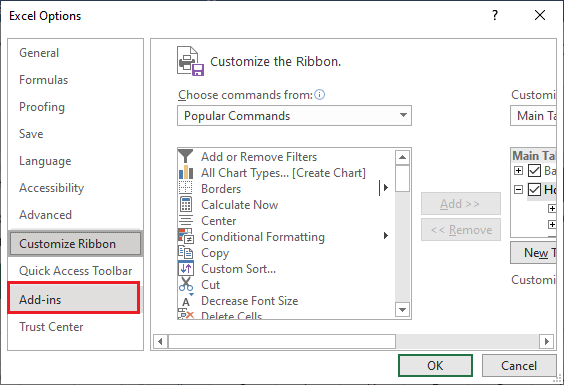
Step 3: Click Go button next to the Manage Excel Add-ins.
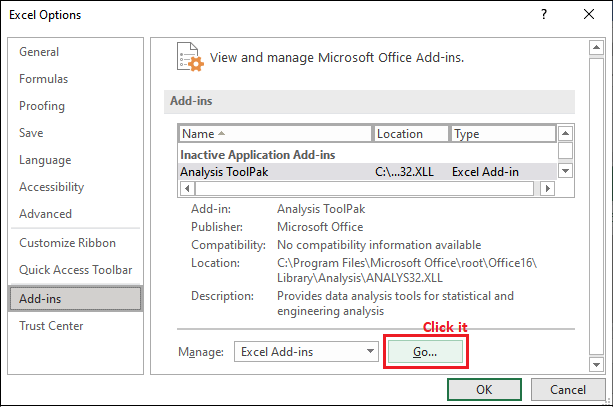
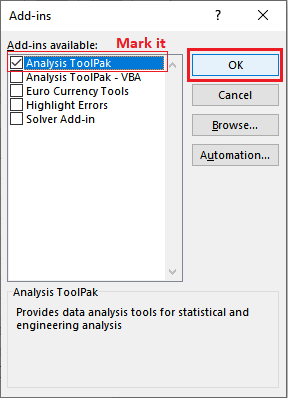
Step 4: Here, mark the Analysis ToolPak and click OK to add it to the Excel ribbon.
Your selected Analysis ToolPak will add to the Excel ribbon inside the Data tab. You can find it there.
Step 5: Now, go to the Data tab from where you can find Data Analysis option and perform the above steps.
Key points
There are some key points that the user should know.
- Computing the correlation coefficient is a time-consuming process. But if you use software like MS Excel, you can save time and effort also make it easy to calculate.
- It shows how closely two variables are correlated to each other. It can be used in statistics, economics, and business plans.
- If you get the returned coefficient value as 0, it indicates to no linear relationship.
- The correlation coefficient value between 0, 1 and -1 represents the weak, strong, and moderate relationship.


