

Excel Features
What is MS Excel?
MS Excel is a spreadsheet that is developed by Microsoft for Windows, macOS, Android, and iOS. The features include in MS Excel are pivot tables, graphing tools, and a macro programming language called Visual Basic for Application (VBA). MS Excel is the most widely used Microsoft Office application. MS Excel is a spreadsheet program for storing and analysing numerical data.
In other terms, MS Excel is a spreadsheet tool that allows anyone to enter data into tables. With the help of the Excel spreadsheet, we can analyse the data easily. The image below shows how an Excel spreadsheet appears:
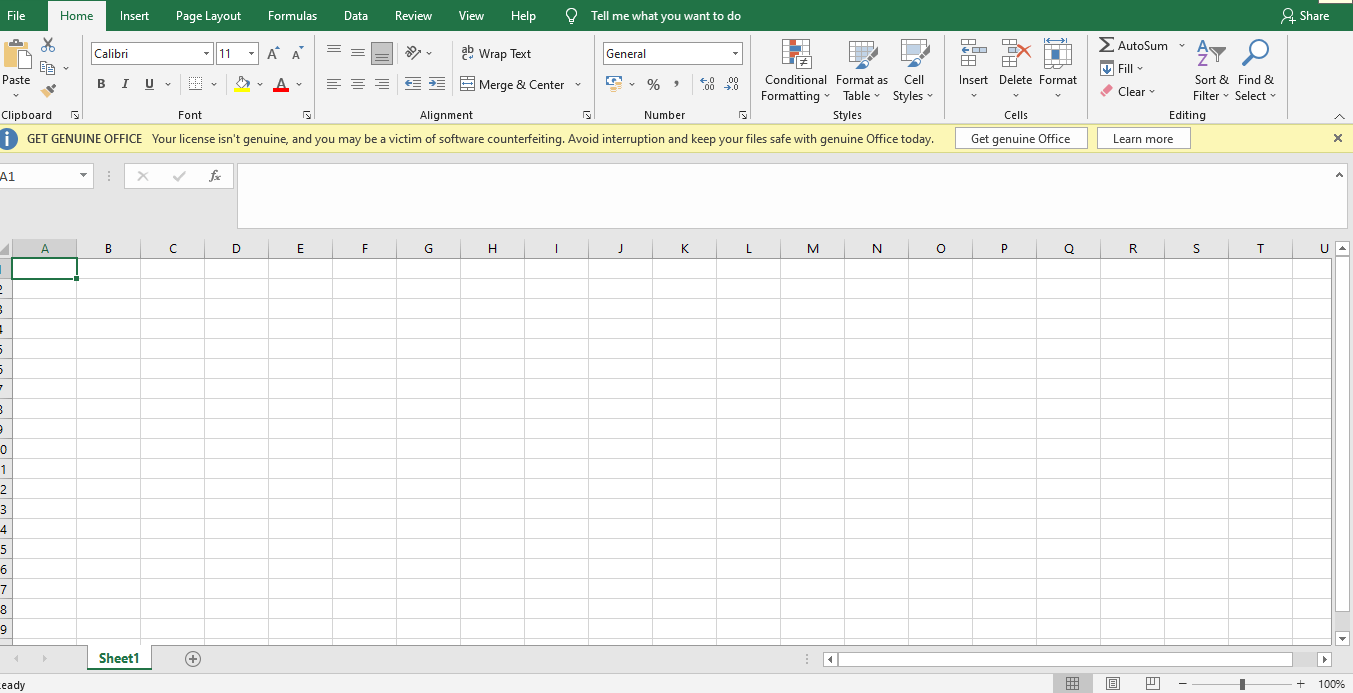
It is a spreadsheet program with several columns and rows, where each intersection of a column and row is referred to as a “cell.” Each cell includes a single piece of data or information. We may make information easier to access and automatically draw information from changing data by organizing the data in this way.
Features of MS Excel
The following are the features of MS Excel:
1. Graphical Features of Excel
Excel offers a lot of graphical features for presenting data in graphs and pictures:
- Charts: Charts can be used to represent the data in richly detailed graphical format.
- SmartArts: We can utilize SmartArts to express information by aligning data in creative ways graphically.
- Clip Arts: We can include ready-to-use clip arts to convey our message in a visual format.
- Shapes: We can use a variety of shapes to depict data in infographics and shapes. With the help of the free form features we can draw any shape.
- Pictures: Any image can be inserted to enhance the objects. For example, backgrounds of Worksheets, shapes, and charts.
2. Functional Features of Excel
Excel Tools and Features assist us in performing complex calculations and enhancing the Excel application’s features.
- Functions: – In Excel Cells, more than 300 built-in formulas are available (Text, Date, Maths, String, etc.), which may be used to execute multiple computations.
- Hyperlinks: – We use hyperlinks in Excel to navigate the different parts of the workbook fast.
- Spellcheck: – We can avoid grammatical and spelling errors in the data by using the built-in spell check feature.
- Add-ins: – We may develop Excel Add-ins using VBA or.NET to progress the functionality of the spreadsheet.
- VBA Macros: – VBA programming is included in Excel. The Macros Functionality can be used to automate repetitive operations.
- Protection: – Workbook, Worksheet, and VBA Protection options are available in Excel.
- Conditional Format: – We can format the data based on the specific criteria. This aids in highlighting the crucial data range.
- Excel offers a wide range of add-ins for data analysis and ETL.
3. Database Feature of Excel
Excel may be used to create databases and carry out a variety of data processing operations.
- PivotTables: Summarize data can be used to create an effective cross table.
- Tables: We can group the rows and columns using parent and child records. This will make it easier to conduct additional research rapidly.
- Grouping: With parent and child records, we can group the rows and columns.
- Sorting: In Excel, we can sort the data. We can sort the data in Ascending or Descending order with one or more than one column.
- Filtering: The data can be filtered in Excel. In order to filter with essential options, we can set a verity of the option. In Excel, there is an option of Advanced Filtering, which allows us to perform more complex filters.
- Sparklines: Excel 2010 introduced the ability to insert light- weight charts into cells.
- Database: To install 1 million records, we can utilize Excel as a database. We have the ability to connect to a variety of databases and import data into Excel.
- Data Validations: We can use the Data validation functionality to restrict the types of data that can be entered into a cell. We can also provide a drop-down menu where we can choose from a pre-defined list of options.
- Slicers: – In Excel 2010, Slicers were added, which allow us to connect several pivot tables and filter data using buttons.
Features of Excel 2007
The following are the features of Excel 2007:
- Ribbon Menu: Excel 2007 added the ribbon menu, giving it a more modern look and feel.
- More Rows and Columns: This feature expands the number of records and fields stored in each spreadsheet.
- Themes and Styles: With the help of this feature, we can easily switch from one colour scheme to another.
- Open XML: Excel 2007 introduced the feature of Open XML file structure.
- Formulas, Charts, and PivotTables have been improved, and new features have been added.
Features of Excel 2010
Slicers and Sparklines are two of Excel 2010’s most essential new features:
- Slicers: PivotTable Slicers in Excel allow us to filter several PivotTables with a single click.
- Sparklines: With the Sparkline feature, we can now make dashboards with graphs in Cells.
- Excel 2010 comes with Mobile Excel for Windows 7 and a plethora of new performance enhancements.
Features of Excel 2013
Excel was known as MDI (Multiple Document Interface) until 2010, but it is now known as SDA (Single Document Application). Excel 2013 boasts a more polished and modern appearance along with many more performance features.
- In Excel 2013, there are various quick tools for charts.
- Quick Data Analysis Tools were added to Excel 2013.
- Excel 2013 adds a new start screen feature.
- The ribbon menu has been enhanced and is now equivalent to the application menu in Windows 8/10.
- Excel 2013 has improved Graphics and Picture Quality.
- In Excel 2013, many additional colour schema xml files have been added.
Features of Excel 2016
The appearance of Excel 2016 is identical to that of Excel 2013.
- In Excel 2016, Pen is added so that we can draw the shapes.
- New Charts: Sunburst, Histograms, Waterfall, and Pareto Charts.
- Icons: New command that permits us to browse among the office icons and insert ready-to-use vector icons.
- Scalable Vector Graphics: In Excel 2016, we can insert SVGs in Excel.
Top 10 Features of Excel 2019
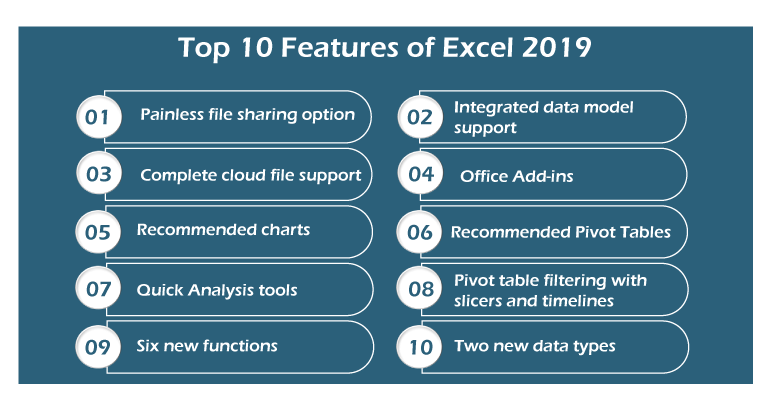
Below are the top 10 features of Excel 2019:
- Painless file sharing option
- Integrated data model support
- Complete cloud file support
- Office Add-ins
- Recommended charts
- Recommended Pivot Tables
- Quick Analysis tools
- Pivot table filtering with slicers and timelines
- Six new functions
- Two new data types
1. Painless File Sharing Options
Using Excel 2019 to share files and co-author spreadsheets with co-workers has been easier or more convenient. In the worksheet view, the Share button is located on the right side of the row with Ribbon tabs, making it easier than ever to share our Excel online. We cannot only invite others to view and edit workbooks which are saved on our OneDrive in the cloud, but we can also present them in online Skype sessions and share them on social media websites.
2. Integrated Data Model
Excel 2019 allows us to construct genuine one-to-one and one-to-many relationships between data tables imported from standalone database management tools and data lists created in Excel. The relationships between the data tables and lists in the Data Model allow us to use the data from any of their columns in the Excel pivot tables and charts which we generate.
3. Complete Cloud File Record
The Excel Save (File→Save) and open (File→Open) screens make it simple to save and update our favourite worksheets on our OneDrive or Company’s SharePoint team site. When we save a workbook file to the cloud manually, Excel’s new AutoSave Function saves all of our editing changes to the workbook file as we work. We can then open a Version History task pane by clicking the new Version History button (to the right of the Share button on the row with the Ribbon tabs) to see all the previously saved versions of the file, which we can copy or restore.
- We can access our Excel workbooks from any device running Excel 2019 if we save them to one of these cloud storage locations (which we can add our Windows tablet and smartphone along with our desktop and laptop).
- Furthermore, if we do not have access to a computer running Excel 2019, we can still examine and update our workbooks using Excel online, which can be accessed through practically any major online browser.
4. Office Add-ins
Office Add-ins allow us to extend the capabilities of Excel 2019 by allowing us to install a variety of specialized little programs (also called apps), which are available from the Office Store directly within the program.
5.Recommended Charts
Not sure which form of the chart will best display our data? Simply place the cell pointer anywhere in the data table, select Insert→Recommended Charts from the Ribbon. The Insert Chart dialog box appears, with a Live Preview showing how the table’s data will appear in several types of charts. Once we have found the chart that best displays the data, we simply click on the OK button to embed the chart in the table’s worksheet.
6. Recommended Pivot Tables
If we are a novice creating pivot tables for Excel data lists and data tables imported from standalone database management tools, Excel can now recommend and generate one for us.
Simply we need to locate the cell cursor in one of the data list’s cells, and select Insert→Tables→Recommended PivotTables on the Ribbon. Excel 2019 then opens the Recommended PivotTables dialog box appears, displaying a list of different pivot tables, which we can build on a new worksheet in the current Excel workbook by pressing the OK button.
7. Quick Analysis Tool
In Excel 2019 worksheet, the Quick Analysis tool displays in the lower-right corner of any selected table. Applying conditional formatting, producing a chart or pivot table, adding the values in rows or columns or sparklines for the data in the selected table are the possibilities available with this tool.
And thanks to Excel’s Live Preview feature, we can see how our table data would seem using the several options before we apply any of them.
8. Pivot Table Filtering with Slicers and Timelines
Slicers in Excel 2019 allow us to easily filter data in our pivot tables across several columns using onscreen graphic objects. We can use a timeline to graphically filter pivot table data based any date type in the Data Model.
9. Six New Functions
Excel 2019 has six new functions that many users will like. The six new functions in Excel 2019 are as follows.
- CONCAT
- MAXIFS
- MINIFS
- TEXTJOIN
- IFS
- SWITCH
10. Two New Data Types
Stock and Geography are two new data types in Excel 2019 which we can use to link data from the internet to our spreadsheets. We can link selected aspects of data related to the company into our spreadsheets to help with reporting and analysis.
We may also use Geography data types to link demographic and other data about cities and states in our spreadsheets.
Stock, and Geography data type, offer easy and fast access to data that many business professionals need to include in their spreadsheets without having to spend time looking for it or manually entering it. As a result, these two new data types should make working with Excel more efficient and precise.


