How to Create Financial Scenarios in Excel
- Scenario 1 : Sales Data increases by 10% ( conservative)
- Scenario 2: Sales Data increases by 20% ( Aggressive)
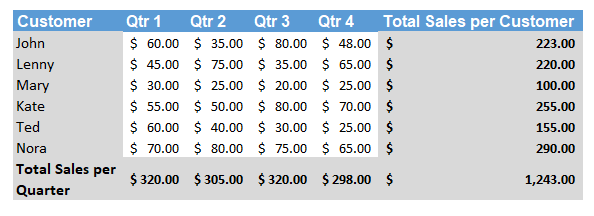
Step 1: Insert the sales data per customer per quarter for the sample year.
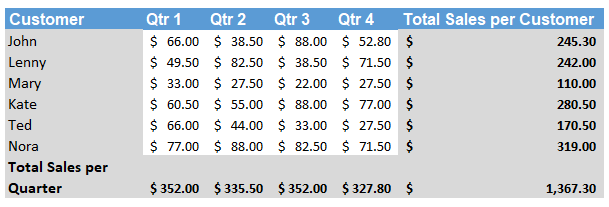
Step 2: Recreate the same chart in a separate sheet where all the sales have increased by 10%.
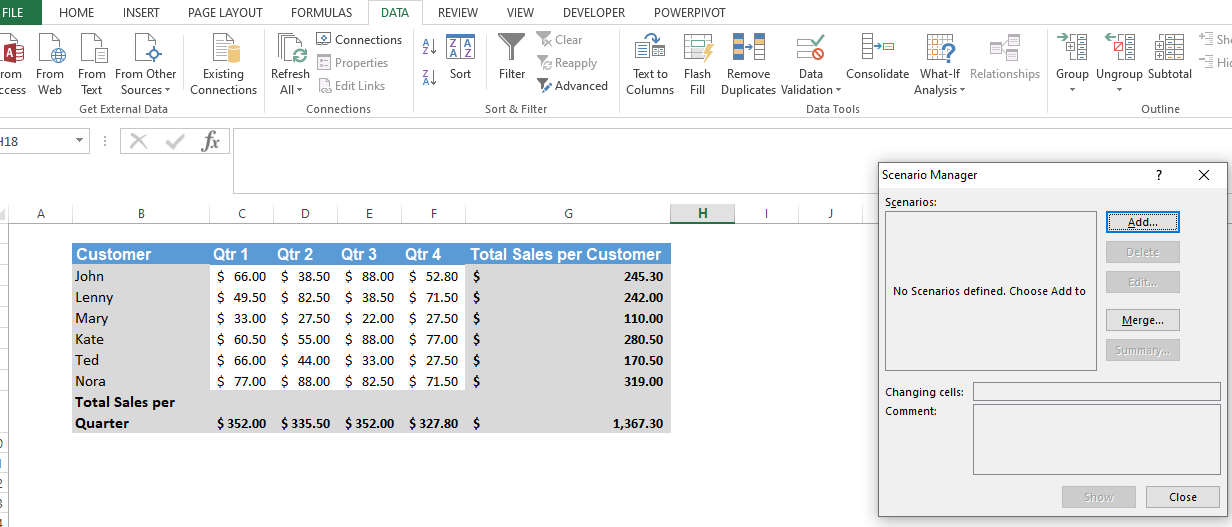
Step 3: Select Data tab -> What-if Analysis -> Scenario Manager -> Add Scenario
Step 4: Add scenario. Scenario Name: Conservative Select the Total sales per customer and total sales per Quarter in changing cells as below
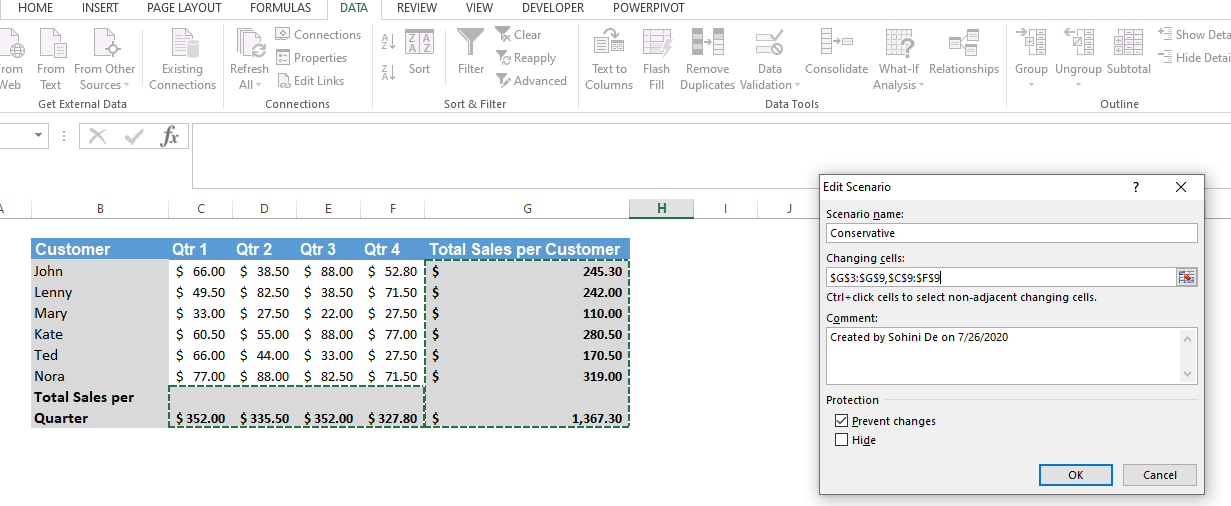
Step 5: Click ok
Step 6: Now, increase the sales by 20% and recreate the same data as follows.
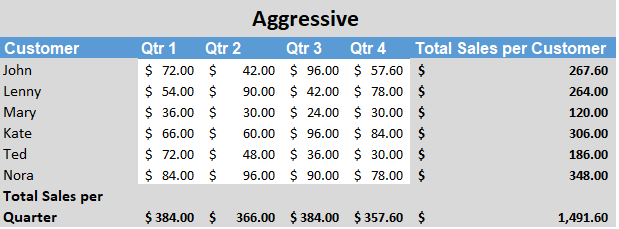
Step 7: Select Data tab -> What-if Analysis -> Scenario Manager -> Add Scenario
Step 8: Add scenario. Scenario Name: Aggressive
Select the Total sales per customer and total sales per Quarter in changing cells as below
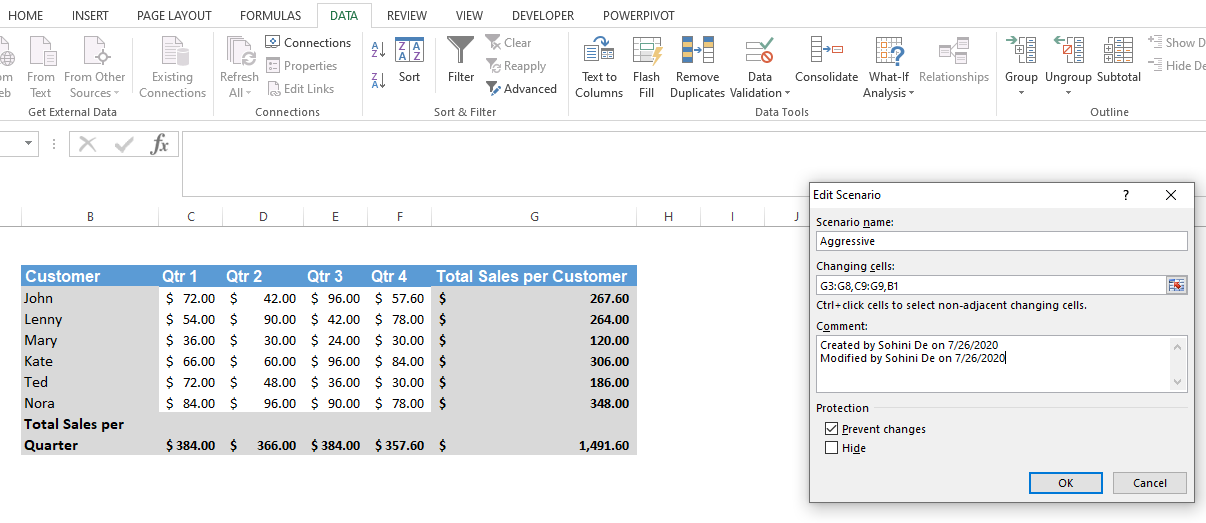
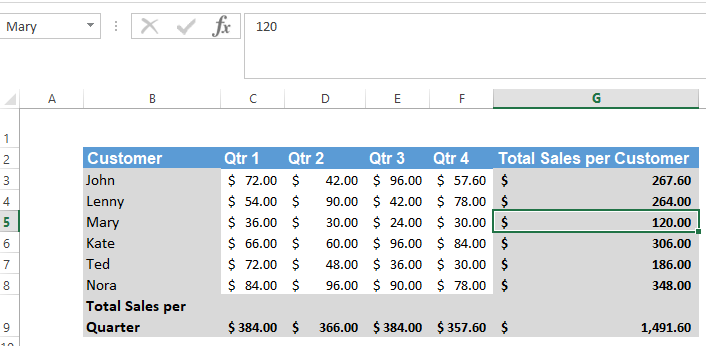
Step 9: Rename all the cell number of Total Values with names of customer and names of quarters
Step 10: Select Data -> What-if analysis -> Scenario manager -> summary -> scenario summary -> total sales -> ok

Step 11: A scenario summary will be automatically generated. Hide/Delete unnecessary columns to get an idea on the changing figures.
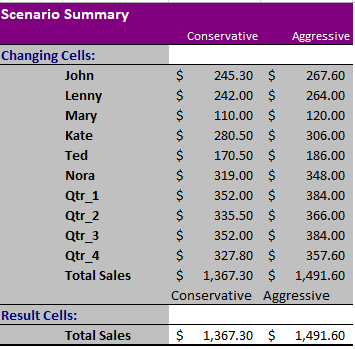
Multiple other financial scenarios can be created.
The scenario-manager can store up to 32 values for a single financial scenario. Scenarios can also be created using Macro in Excel.
Template
Further reading:
Basic concepts
Getting started with Excel
Cell References


