Programming Charts
Below we will look at two programs in Excel VBA. One program loops through all charts on a sheet and changes each chart to a pie chart. The other program changes some properties of the first chart.
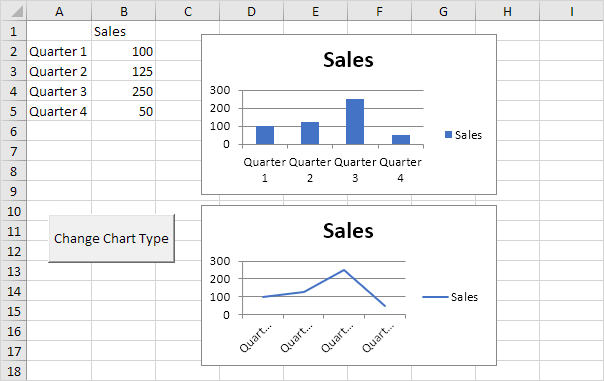
1. Create some charts (or download the Excel file).

Place a command button on the worksheet and add the following code lines:
1. First, we need to declare a ChartObject object. The ChartObject object acts as a container for a Chart object. We call the ChartObject cht but you can use any name.
2. The ChartObjects collection contains all the embedded charts on a single sheet. We want to loop through all charts on the first sheet. Add the following For Each Next loop.
For Each cht In Worksheets(1).ChartObjects
Next cht
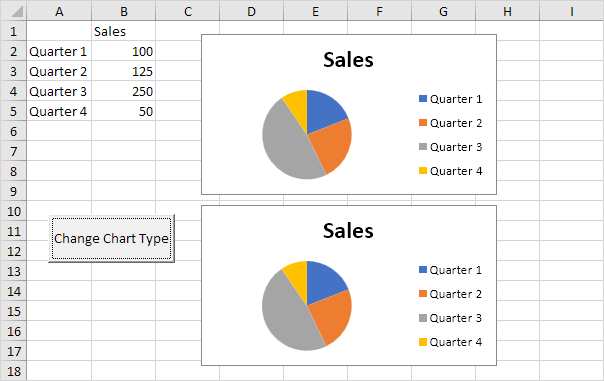
3. The Chart object represents a chart in a workbook. Add the following code line to the For Each Next loop to change each chart to a pie chart.
Note: again, cht acts as a container for the Chart object. We use the ChartType property to change the chart type. We use the built-in constant xlPie to change each chart to a pie chart.
4. Result when you click the command button on the sheet:

Now we will change some properties of the first chart.
Place another command button on the worksheet and add the following code lines:
5. The ChartObjects collection contains all the embedded charts on a single sheet. Add the following code line to activate the first chart:
We can now refer to this chart as the ActiveChart.
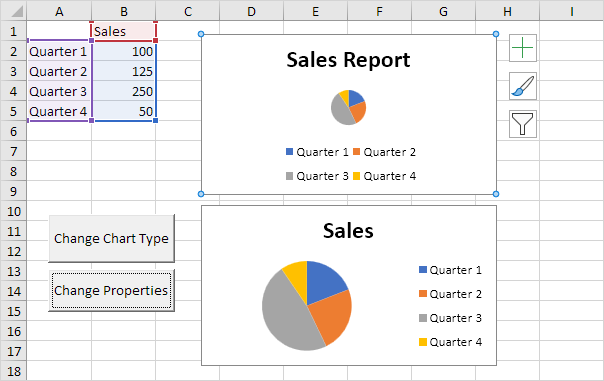
6. Add the following code line to change the Chart title.
7. Add the following code line to move the legend to the bottom of the chart:
8. Result when you click the command button on the sheet:

Next Chapter: Range Object


