

MIS report in Excel
MIS refers to the Management Information System. An MIS report is created by collecting the data comparing and analyzing it. The MIS reports are prepared to analyze the performance of business/organization. Several types of MIS reports can be created to generate different reports, such as HR MIS reports, inventory reports, profit reports, etc.
This chapter will brief you about the MIS report, types of MIS report, how does it create in Excel, and all other topics related to it.
What is an MIS report?
An MIS report is basically a collection of data that is collected after comparing and analyzing the data. This data is related to daily tasks and business processes. It is a summarized report using which you can monitor the functioning of your business.
There are several types of reports like HR MIS reports, inventory reports, profit reports, etc. These reports are categorized into four categories. With the help of these reports, one can manage the daily business activities and problems by creating different reports.
Advantages of MIS report
Following is a list of advantages by which you can understand why should you create the MIS report –
- MIS report helps to increase the productivity to a higher level.
- Helps to determine the current trends in market.
- By preparing the MIS report, you can identify the problems of your business.
- It enables you to make better decisions for your business by understanding the lack of productivity or performance.
- It is one of the best ways for communication between employees and department heads.
- Using the MIS report, one can make strategic planning for their business and determine the business needs.
In the same way, various other advances of creating MIS report that helps in growth of your business.
Components of MIS report
MIS reports have five major components that are required for preparing the report. They work together to achieve the business goal. These are –
- User
- Data
- Hardware
- Software
- Business plan of action
These are the components of the MIS report.
MIS report categories
MIS reports are categorized into four categories. Each category holds types of reports. These four categories are –
- Summary Report
- Tread Report
- Exception Report
- On-demand Report
Summary Report
A summary report is the most commonly used report of Excel. It is common because it pertains the day-to-day picture of the business. It represents the report in a simpler manner and aggregates the information that makes sense.
For example, an inventory report will include the value of inventory in stock and value of new purchases too. Similarly, a sales report is a detailed description of daily sales, such as discounts, payments, taxes, and liabilities.
Tread Report
Tread reports are very helpful for comparative data, which means these reports enable to compare the present performance with past performance.
For example, with the help of customer data, you can analyze that your customer’s shopping habits are changing.
Exception Report
As the names specify, an Exception report includes the anomalies. This type of report contains every single instance of an abnormal condition. All these abnormal occurrences are placed in a single place so that the management can access them easily. These require immediate measures to manage risks.
The main purpose of creating this type of document is to show that the actual performance deviates significantly from exceptions.
On-demand Reports
On-demand reports are created when one requires to generate an MIS report. The on-demand report format and information inside it depend on the current situation and person when needs it.
For example, a sales rep wants a report for certain products to know how is the sell of these products in holiday season in a particular city at a specific price. So, the MIS report will help how the change in price can affect the probability in sale of the product.
Types of MIS report
There are several MIS reports, i.e.,
Sales MIS Report
The name of this MIS report is self-specified. The sales and marketing departments create and manage the sales MIS report for transactional analysis of products and services. This report includes the comparative data for estimated sales and actual sales. Sales MIS report shows the revenue and all growth factors.
Budget Report
A budget report is required to create for minimizing the expenses in business and manage the finance of business. A common budget report can include cash, expense, income, production budget, etc.
Production Report
The manufacturing department generates the production report that contains the comparison set of targeted production and the final production count. The difference between targeted production and final production help to measure the efficiency of process.
MIS Report in Account
MIS Report in Account can be created by the sales, marketing, and manufacturing department for different purposes. This MIS report provides information of income, assets, liabilities, and expenditure.
Cashflow statement Report
By creating the cash flow statement report, the business operational department can analyze the cash flow. This cash flow is the inflow and outflow of the cash. It means the business operational department can know the overall transaction for a certain time period. It also allows them to trace the fund source utilized for the outflow.
Fund statement Report
The account and finance team prepare the fund statement report to keep tracing the fund sources. This report also helps the account and finance department to check where the funds are utilized.
Profit Report
A profit report is created to compare the difference between estimated and actual profit. This report is again created by the account department. It also helps them to know the factors for the profit and loss.
Profit report is very helpful to analyze the performance of a business. It provides the report for the earned profit with respect to the target one.
Income Statement Report
An income statement report is created to store the income, tax, ledgers, and balance sheet details. Using this report, the account team can analyze the concurrent financial state of the business for which it is prepared. It helps to evaluate the financial data of investors and stakeholders.
Abnormal Losses Report
This report helps the manufacturing department to reduce the expenditure in businesses. Manufacturing defects, defects in raw materials, failure of machinery, or natural tragedies come under abnormal losses.
Costing Report
Cost is one of the most important factors of any business. Whether it is a small enterprise business or a large organization, it is very necessary to prepare the costing report. Analyze the overall costs that are incurred by different departments to see if they can be reduced.
HR MIS Report
HR MIS report is prepared by the HR department to analyze the employee’s performance for a certain duration. This report is essential when the top-level department wants to know the performance of employees. It basically contains the total task assigned, assignments, or projects done by the employees.
Inventory Report
An inventory report is created to keep the information about the raw materials. It keeps daily, weekly, monthly, and quarterly reports for production and stock. Using this, you can analyze which raw material is leftover and which one needs to be restocked.
Statistical Publications
This kind of report is a special type of report that is required in decision-making and planning. Basically, it is important to analyze the data and develop an accurate report.
Orders in hand Report
This report is created by the marketing and sales department. It is helpful for maintaining the ratio between the production capacity of the product and the order you received for the products.
Report on ideal time
As the name implies, this report contains the report of workers that how much time they were idle on different tasks. This can be due to a lack of resources or finished row materials. This report is created for storing the idle time information and reason for it.
Machine utilization Report
Machine utilization report holds the information for the machinery utilized. It helps to count how many hours a machine was utilized and also know the amount of time it stayed idle.
Machine utilization report is prepared for manufacturing divisions by the superior in change.
How to create MIS report?
You have learned what is MIS report, its advantages and its categories. Now, you will see how to create an MIS report in Excel for a certain dataset. By following a few steps, you can create different MIS reports in Excel.
Convert the data in tabular form
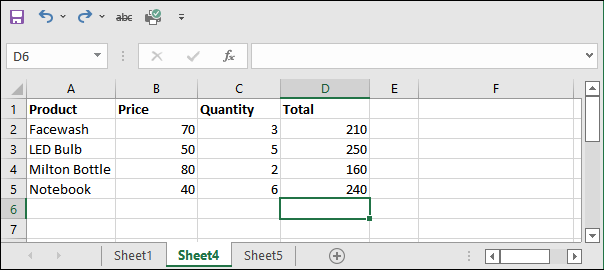
Step 1: We have some data in Excel. Make sure there should not be any macro applied on data before preparing the MIS report.
Step 2: Select the data along with header and press the Ctrl+T to convert the data to a table. It will open a panel to select and create the table for Excel data.
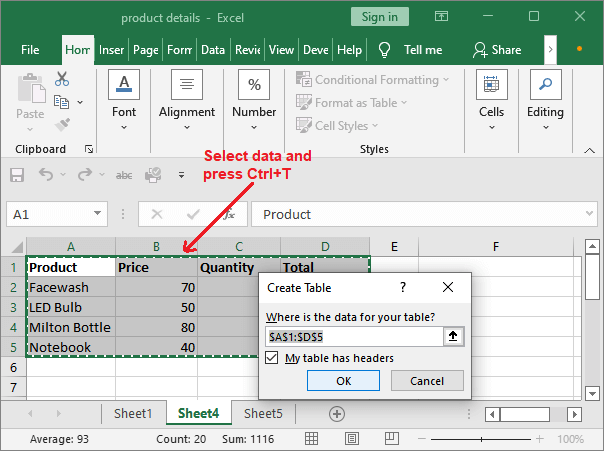
Note: Use Ctrl+T shortcut key in window and CMD+T in Mac operating system to convert the excel sheet data to table.
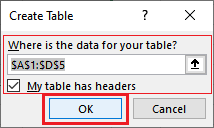
Step 3: As our data has header. So, keep marked the My table has headers checkbox. Now, press OK button.
Create a pivot table
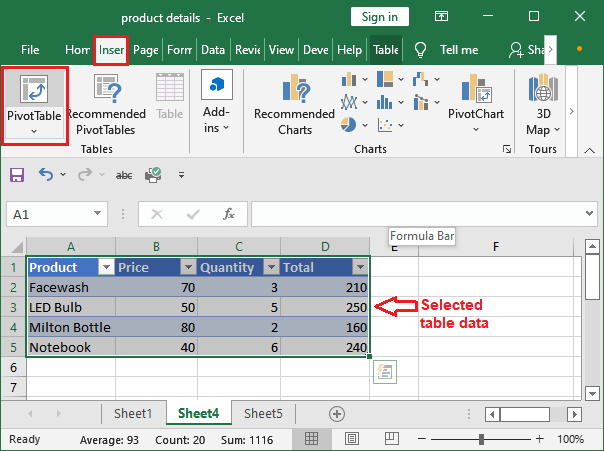
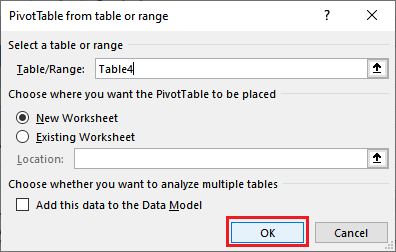
Step 4: Select the data in table and move to the Insert tab. Here, click the Pivot table option here.
Step 5: One more time, for the selected range of the table. Keep all the other options same and press OK on this dialogue box.
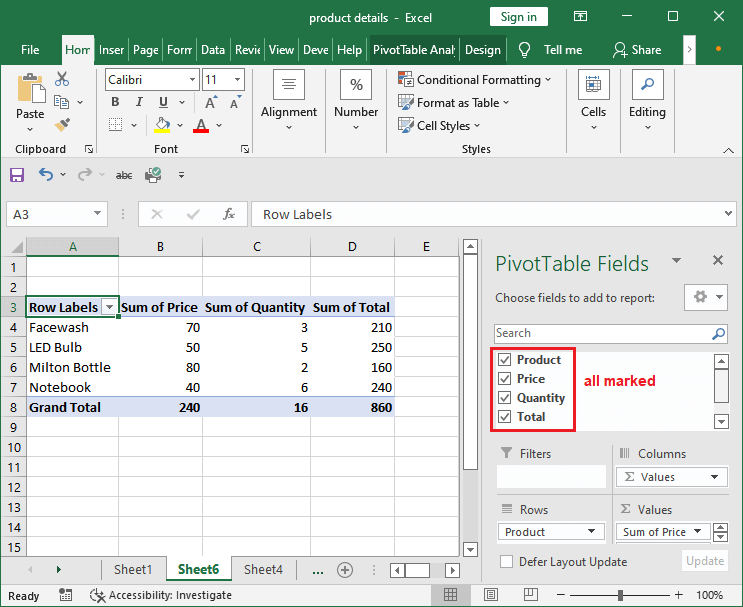
Step 6: A new sheet will be created with pivot table. Select the parameter you want to display in the table.
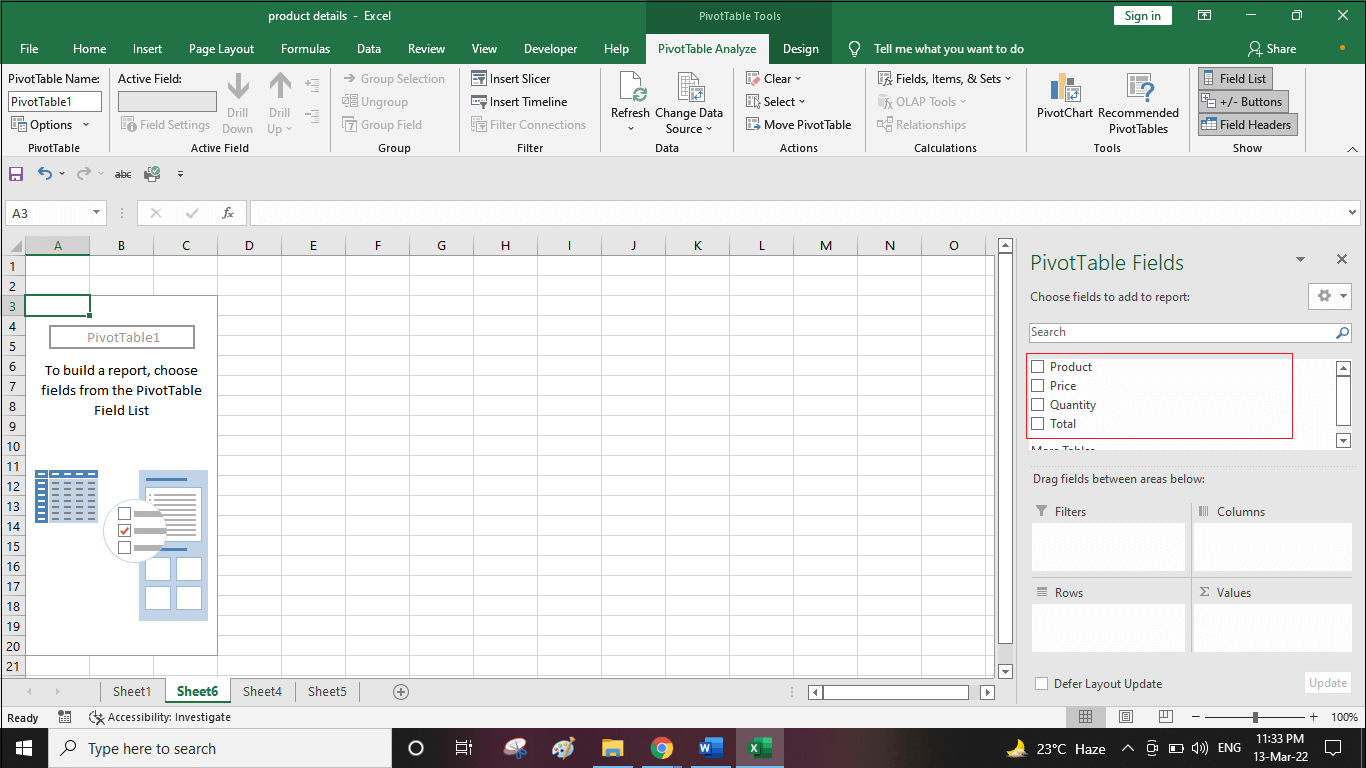
Step 7: A new pivot table will generate in MS Excel.
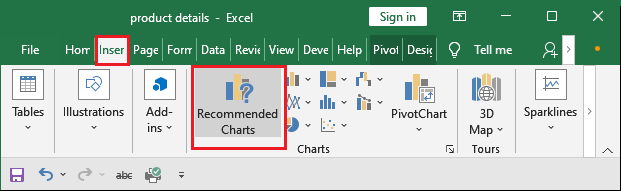
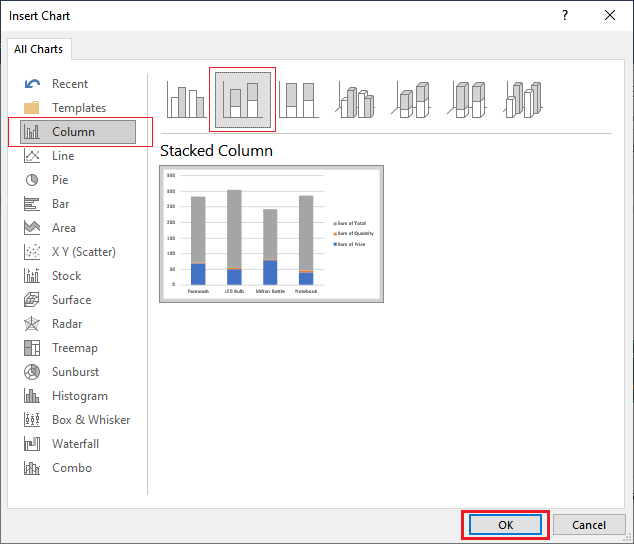
Step 8: In this pivot table, select the data and go to the Insert tab to insert a pivot chart. So, click the Recommended Chart option here.
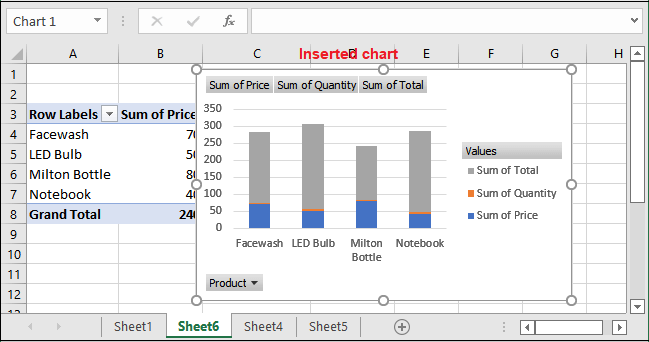
Step 9: Move to the All Charts option and select a chart you want to insert. We have selected a column chart (Stacked column chart) for this data.
Step 10: See the chart for the data. You can follow the same steps to generate the other charts.
How does the MIS report work?
MIS report is such kind of report that provides a concise view of company performance. The company performance such as revenue, customer query, order, HR indices, employee performance, so on.
By taking the help of MIS report, the users can analyze the estimated targets with the achieved result. The main objective of this report is to provide insights into business modal by contributing condensed disparate figures.


