Box plot in Excel
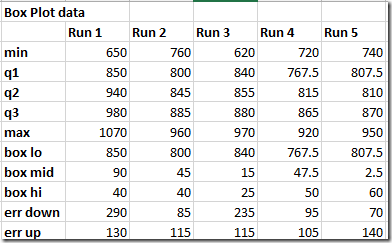 Click on INSERT tab, click on Insert Column Chart and then click on Stacked Column.
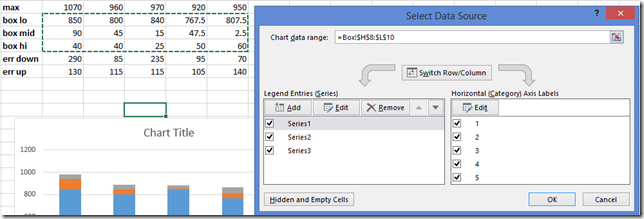
Right click on the chart and click on Select Data. Select “box low, boxmid and box high” range.
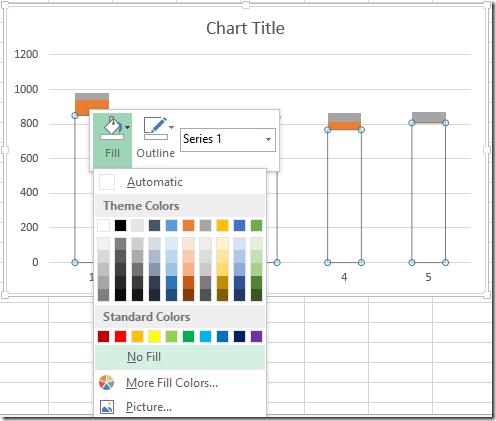
Right click on the bottom blue bar and change both the OUTLINE and FILL to nothing
Click on the + sign, select error bars. Choose series 2. Click on more option. In the task bar to the right select CUSTOM and then SPECIFY VALUE.
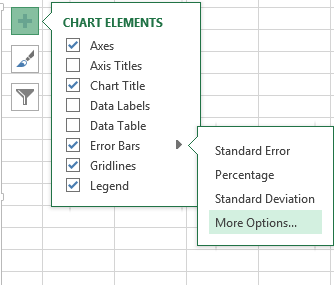
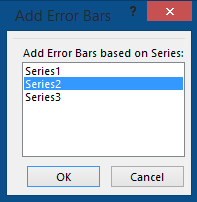
For positive error values select error up and for negative error values select error down.

That’s it. Box Plot is ready.
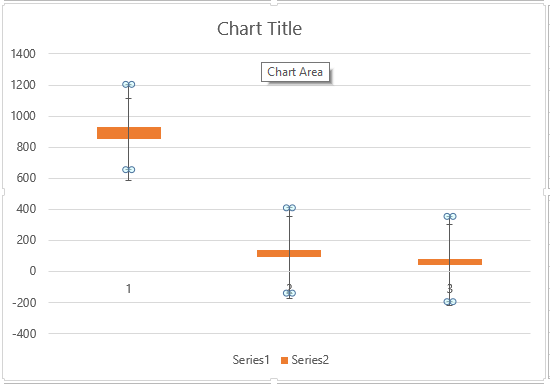
Template
You can download the Template here – Download
Further reading:
Basic concepts
Getting started with Excel
Cell References


