How To Create A Chart With Grouped Data
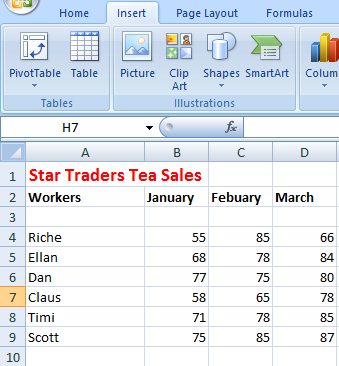
1. Prepare a table and group data there.

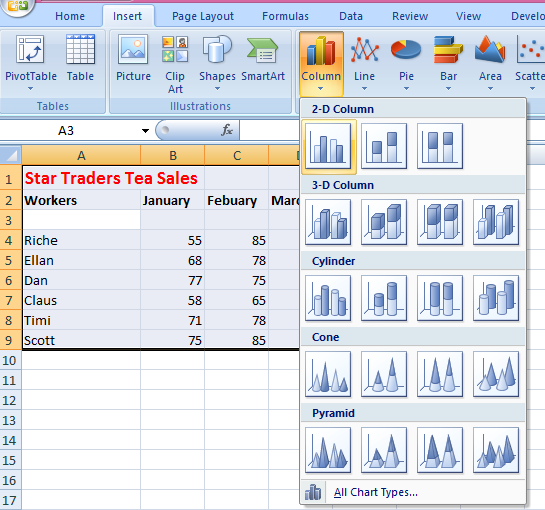
2. Select data and under Insert option in toolbar, In Column select first option.

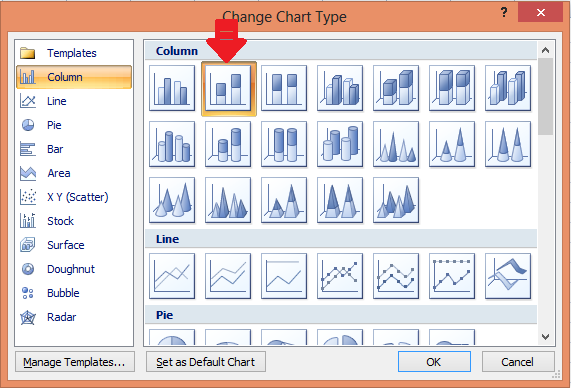
3. Now in Toolbar under Design option, select Change Chart Type option.

4. Choose Stacked Column option.

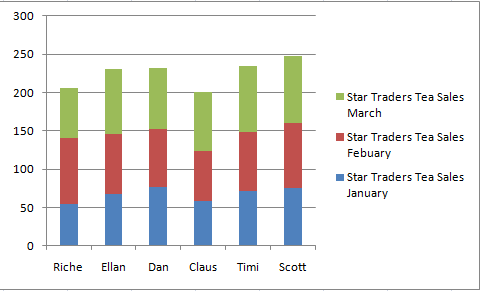
5. Here you have your chart for grouped data.

Template
You can download the Template here – Download
Further reading:
Basic concepts
Getting started with Excel
Cell References


