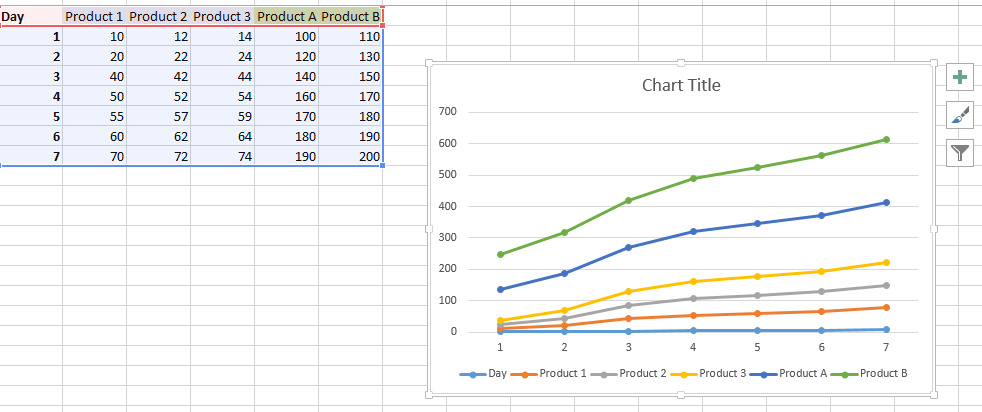
Chart with if statement
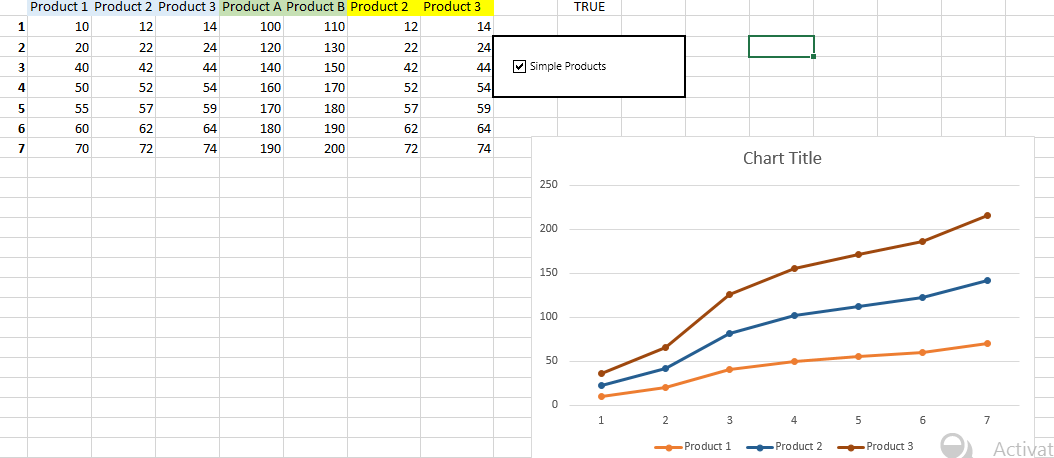
 Now we will start creating the options for the same. We created new columns which have the following formulas: =IF(J1,C1,E1)
This if condition decides if the chart will have column C or E as its series.
So based on value in cell j1 it can be product2 or Products A =IF(J1,D1,F1)
This if condition decides if the chart will have column D or F as its series.
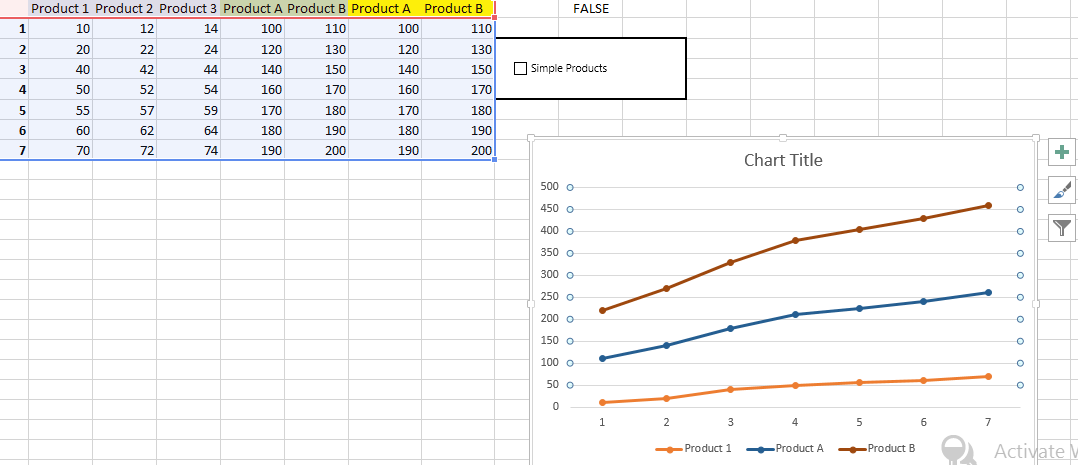
For based on value in cell j1 it can be product3 or Products B So now we have added a checkbox and linked it to the cell j1 and in the graph we have changed the series types including product1 and last 2 column products which can vary.

Unchecking the option:

Template
You can download the Template here – Download
Further reading:
Basic concepts
Getting started with Excel
Cell References


