

How To Calculate Covariance In Excel?
We can detect the existence of a correlation relationship by examining the covariance.
Covariance is the average of the products of the deviations of each data point pair.
Use covariance to define the relationship between two datasets.
- A positive value of covariance occurs when both examined characteristics are moving in the same direction.
- Negative covariance occurs when the increase in the value of one feature tends to decrease the value of the other.
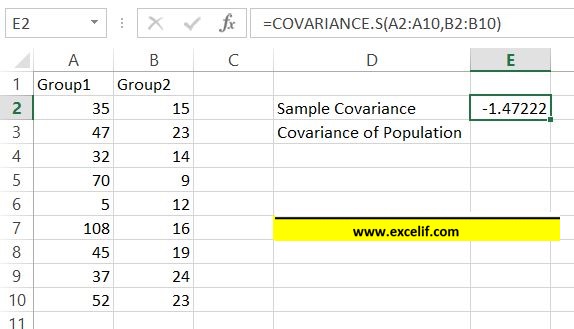
Sample Covariance
To calculate sample covariance use COVARIANCE.S Excel function.
COVARIANCE.S syntax:
=COVARIANCE.S(array1,array2)
In the given example sample covariance formula is
=COVARIANCE.S(A2:A10,B2:B10)
Population Covariance
To calculate population covariance use COVARIANCE.P Excel function.
COVARIANCE.P syntax:
=COVARIANCE.S(array1,array2)
In the given example sample covariance formula is =COVARIANCE.P(A2:A10,B2:B10)
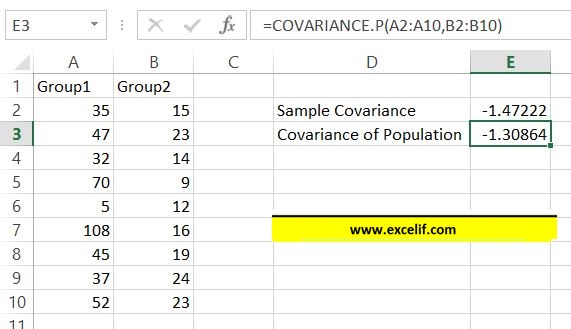
In most cases you will use sample covariance. Use covariance of population function only when it is specifically said that it population covariance.


