How to calculate variance in Excel
What is the variance?
Variance is the basic measure of the variability of the results observed.
Variance tells you how far the spread in the set of measurement’s. In other words, whether the results are more centered around the mean or whether there are large differences between the mean and individual scores. It means that the higher variance the more different values.
Variance is always positive (except for the variance for the constant where the variance is zero).
The variance of the numbers x1, x2, …, xn is the arithmetic mean of the squares of deviations from their arithmetic mean. Variance is the squared value of standard deviation.
Let’s see the mathematical example for better understanding.
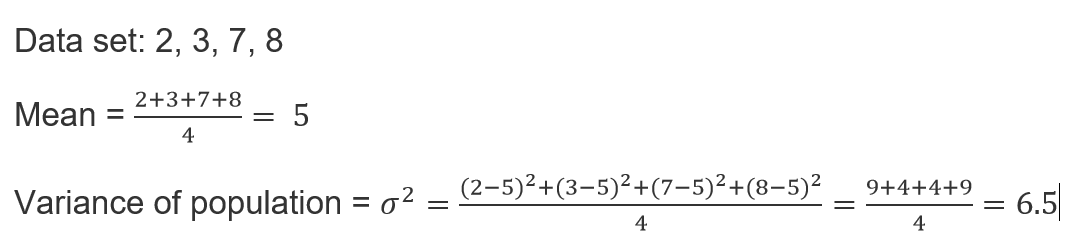
Based on given number I calculated the mean first.
Then calculated the variance in the single equation with the result of 6.5.
Variance in Excel
There are 3 basic functions which you can use to calculate variance in Excel:
- VAR – common function which calculates variance in every version of Excel. However since Excel 2010 version this function is started to be improved and replaced by VAR.S and VAR.P. Although this feature is still available
- VAR.S – calculates the sample variance of a supplied set of values. This is new function in Excel 2010 and its not working in earlier versions of Excel.
- VAR.P – calculates the sample variance of a whole population of values. This is new function in Excel 2010 and its not working in earlier versions of Excel.
With VAR and VAR.S functions you can calculate variance for sample of values. To calculate variance for whole population of values just use VAR.P function.
Syntax of variance functions:
=VAR(number1,[number2],…])
=VAR.S(number1,[number2],…])
=VAR.P(number1,[number2],…])
Examples of VAR function in Excel
Example 1 the simplest syntax of variance
As arguments of function you can use just numbers.
=VAR(2,3,4,5,6,7,8,125)
Example 2 cells as arguments in formula
Arguments could be also cells where you have some numbers.
=VAR(A2,A3,A4,A5)
Example 3 range of cells as arguments in formula
You can also use range of cells.
=VAR(A2:A10,B4:C10)
Example 4 mix of above examples in one formula
It is not a problem to use every kind of above arguments in one formula.
=VAR(A2:A10,B4,5,7)

Syntax of VAR.S (function for sample variance), VAR.P (function for variance of population) is the same as VAR.
Example 5 How to calculate sample variance using Data Analysis Toolpak Add-In?
First you need to make sure your Data Analysis Toolpak Add-In is installed. Here is the lesson how to install Data Analysis Toolpak Add-In.
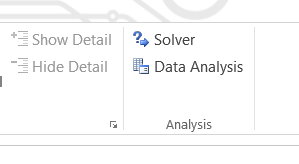
Go to Ribbon to the Data tab. Click the Data Analysis button.
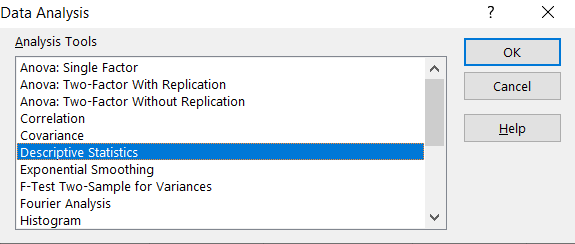
New window appears. Choose Descriptive Statistics and click OK.
Enter the proper parameters:
- Input Range – range of your data ($A$1:$C$10 in my example)
- Labels in first row – there are no labels in my data table
- Output Range – choose where you want to get your variance calculated (I chose the same Sheet $G$1:$T$18)
- Summary statistics – make sure it is checked
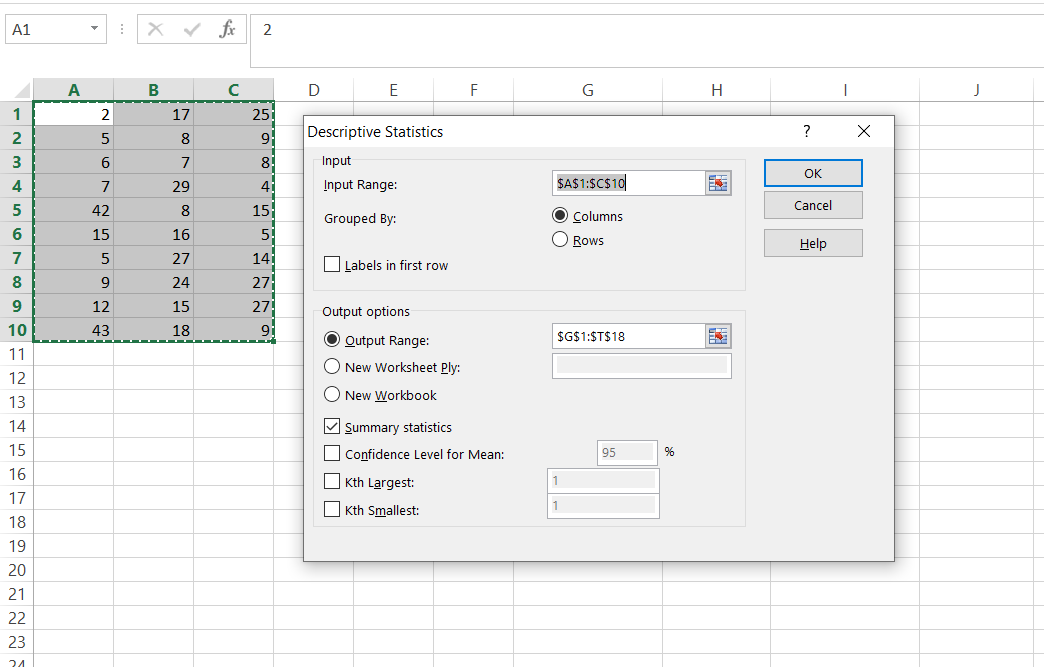
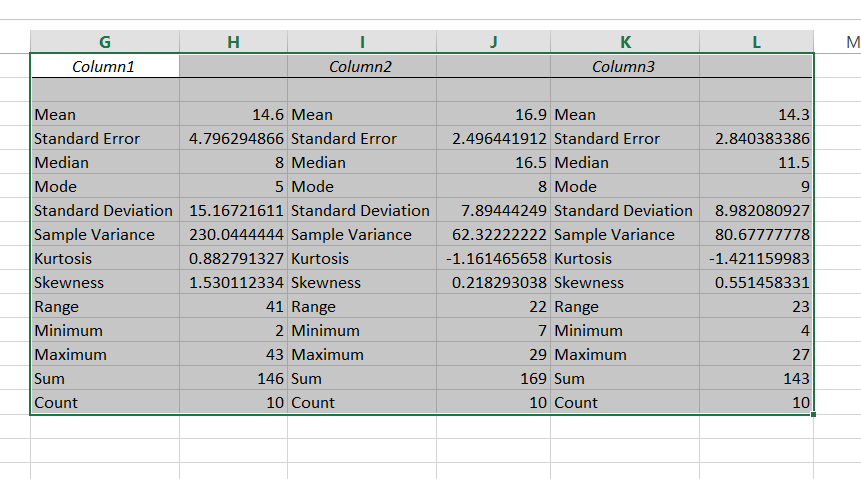
And this is how to see my Statistics summary. Sample variance is calculated in row 8.