Exponential Smoothing
This example teaches you how to apply exponential smoothing to a time series in Excel. Exponential smoothing is used to smooth out irregularities (peaks and valleys) to easily recognize trends.
1. First, let’s take a look at our time series.

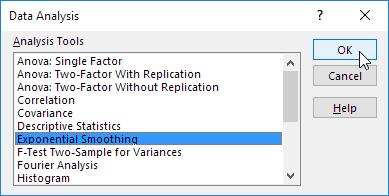
2. On the Data tab, in the Analysis group, click Data Analysis.

Note: can’t find the Data Analysis button? Click here to load the Analysis ToolPak add-in.
3. Select Exponential Smoothing and click OK.

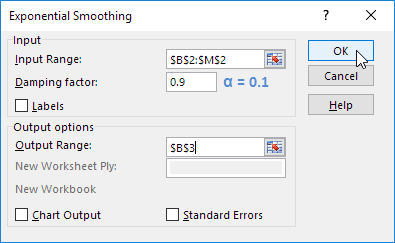
4. Click in the Input Range box and select the range B2:M2.
5. Click in the Damping factor box and type 0.9. Literature often talks about the smoothing constant α (alpha). The value (1- α) is called the damping factor.
6. Click in the Output Range box and select cell B3.
7. Click OK.

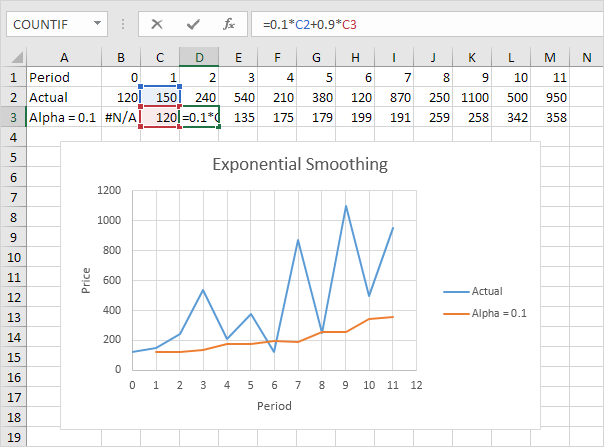
8. Plot a graph of these values.

Explanation: because we set alpha to 0.1, the previous data point is given a relatively small weight while the previous smoothed value is given a large weight (i.e. 0.9). As a result, peaks and valleys are smoothed out. The graph shows an increasing trend. Excel cannot calculate the smoothed value for the first data point because there is no previous data point. The smoothed value for the second data point equals the previous data point.
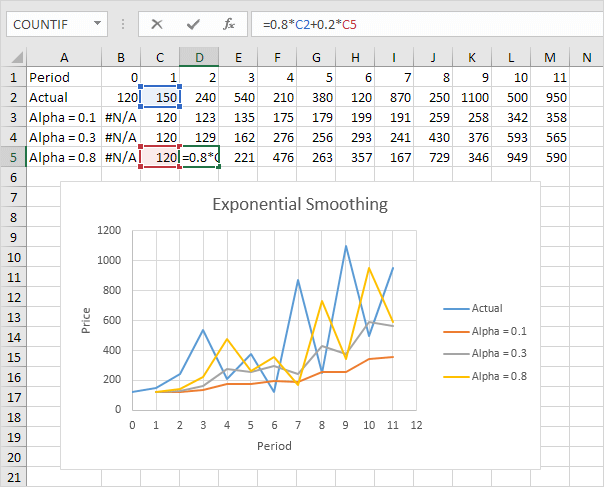
9. Repeat steps 2 to 8 for alpha = 0.3 and alpha = 0.8.

Conclusion: The smaller alpha (larger the damping factor), the more the peaks and valleys are smoothed out. The larger alpha (smaller the damping factor), the closer the smoothed values are to the actual data points.
Next Chapter: Create a Macro


