

How to Make an Excel Sheet
The Spreadsheet is a grid-based file designed to organize information and manage any personal or business data calculation. Spreadsheets are playing a significant role in maintaining an extensive database with excel. People all around the world use spreadsheets to create tables for any personal or business need.
Spreadsheets are available in MS Office and Office 365, from where a user can create a spreadsheet. Here MS office is an on-premise application where Office 365 is based on the cloud.
There are more than 400 functions and many features such as pivot, coloring, graph, chart, and conditional formatting, and many more. This makes it the best choice for the users.
The workbook is the Excel lingo for ‘spreadsheet’. MS Excel uses this term to emphasize that a single workbook can contain multiple worksheets where each can have its own data grid, chart, and graph.
However, spreadsheets have grown from simple grids to powerful tools, functioning such as databases or apps that perform numerous calculations on a single sheet. You can use a spreadsheet to determine your mortgage payments over time or calculate the depreciation of assets and how it will affect your business’s taxes.
You can also combine data between several sheets and visualize it in color-coded tables for an understanding. With all the new functionality, using a spreadsheet program can be intimidating for new users.
Key Features of Excel Spreadsheet
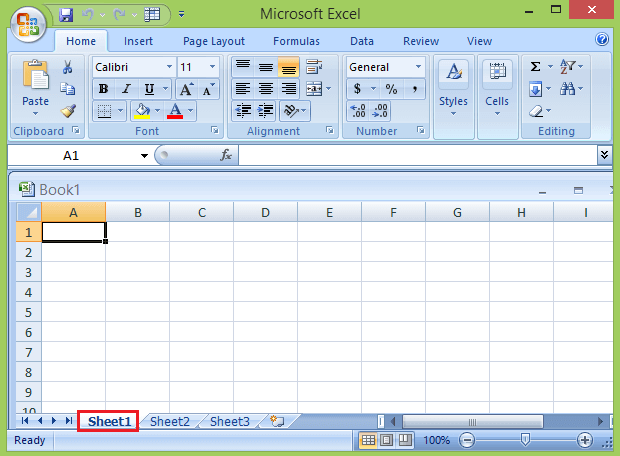
When we open the excel worksheet screen, we could see the below features:
1. Basic App Functions
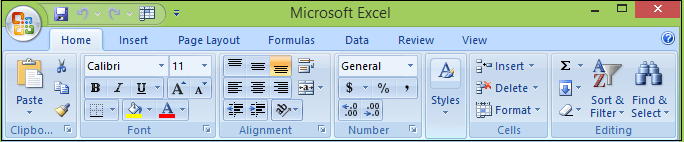
From left to right, along with this top green banner, you’ll find icons, such as: reopen the Create a Workbook page; save your work; undo the last action performed, and display which actions were recorded. Redo a step that’s been undone and select more tools.

2. Ribbon
In the Ribbon, we have several tabs to work with. This grey area is called the Ribbon and contains tools for entering, manipulating, and visualizing data.
Some tabs focus on specific features. By default, home is selected. Click on the Insert, Page Layout, Formulas, Data, Review, or View tab to reveal a set of tools unique to each tab.
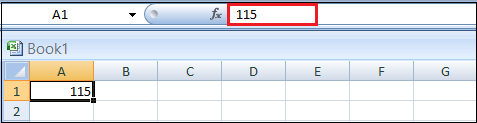
3. Formula Bar
The formula bar in excel is the platform to view the formula or the selected cell or active cell’s value.
For example, if the A1 cell is selected and we have a value in cell A1, we can see the same value in the formula bar.
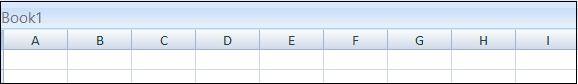
4. Column Header
As you can see, each column has its own heading with alphabet characters representing each column separately.
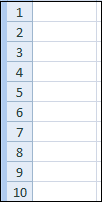
5. Row Header
Alphabets represent column headers, and similarly, row headers are represented by numbers starting from 1. In recent versions of Excel, we have more than 1 million rows.
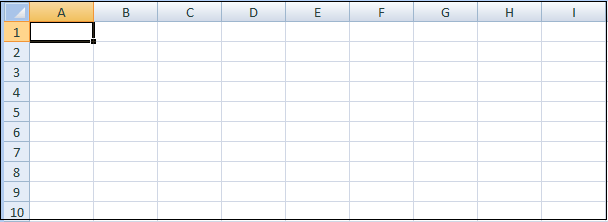
6. Spreadsheet Area
By default, the work area is a grid. This is where we do the work. The combination of column and row forms a cell, i.e., a rectangular box.
Each cell was identified by a unique cell address consisting of a column header followed by a row header. For the first cell, the column header is A, and the row header is 1, so the first cell address is A1.
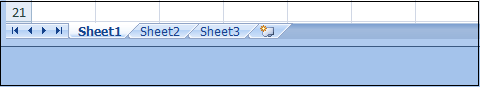
7. Sheet Tabs
This is where you can find the different sheets in your workbook. Each sheet gets its own tab, which you can name yourself. These can be useful to separate data so that one sheet doesn’t get too vast.
For example, you might have an annual budget, where each month is a column, and each row is a type of expense. Instead of keeping it every single year, you track it on one sheet and scroll horizontally. You can make each tab a different year containing 12 months only.
8. View Options
The left icon is Normal, which shows the worksheet as it appears in the image above. The middle icon is Page Layout, which divides your worksheet into pages resembling how it would look when printed, with the option to add headers. And the right icon represents a Page Break Preview, in which you can adjust where the page breaks are by clicking and dragging them.
The slider with the “-” and “+” on it is for scale or zoom level. Drag the slider left or right to zoom in or out.

This is the general overview of the excel spreadsheet. Now we will see how to work with this Spreadsheet.
How to Create a Spreadsheet?
Suppose you want to create a spreadsheet to calculate a simple sale sheet for products in different quarters. You have some products and each product sales in each quarter for the year 2020. Here are the following steps to create a report easily in Excel:
Step 1: Open MS Excel in your system.
Step 2: Go to Menu and select the New button.
Step 3: And click on the Blank workbook to create a simple worksheet.
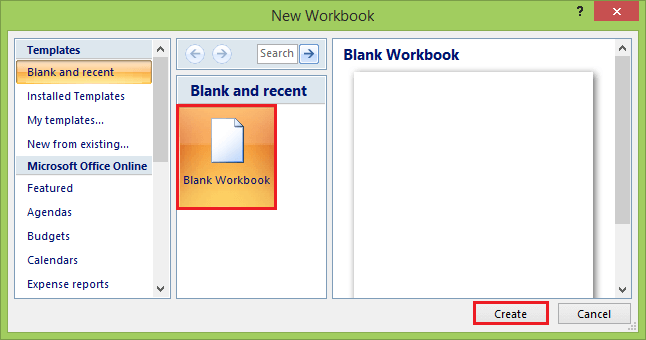
Or you can use the shortcut key, press Ctrl + N to create a new workbook or Spreadsheet.
Step 4: A workbook is the name of the document that contains your spreadsheets.
Step 5: This creates a blank spreadsheet called Sheet1, which you’ll see on the tab at the bottom of the sheet.
Step 6: Go to the spreadsheet work area.
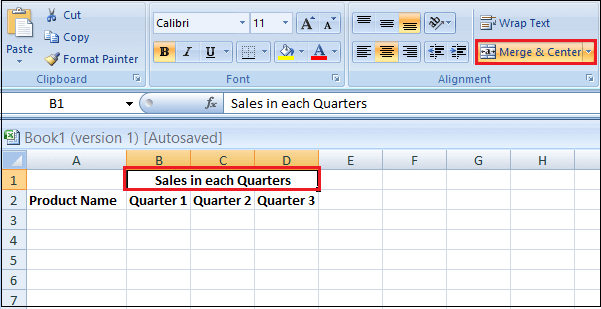
Step 7: Create headers for Sales in each quarter in the first row by merging cells from B1 to D1, and in row 2, give the product name and each quarter’s name as shown below.
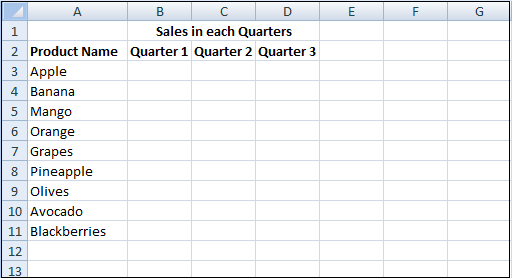
Step 8: Now enter the full product name in the Product Name column.
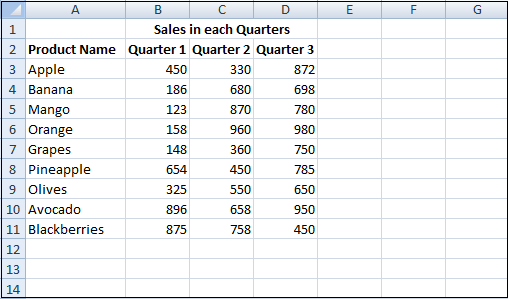
Step 9: And provide the sales data for each quarter in front of every product.
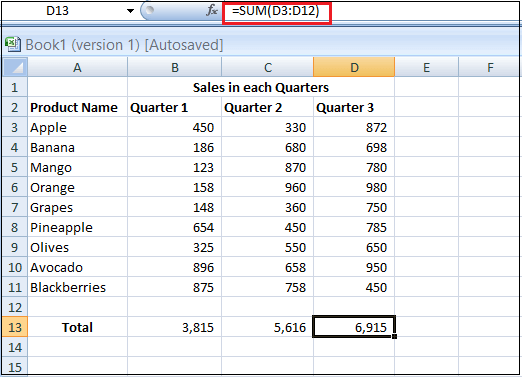
Step 10: In the next row, put one header for Total and calculate each quarter total sales.
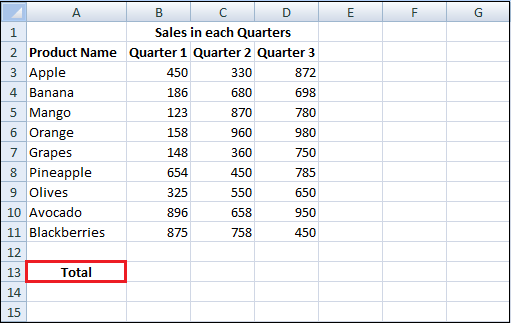
Step 11: Now calculate the total for each quarter by applying the summation function. Apply the functions in cells B13, C13, and D13.
One of Excel’s most useful features is its ability to look up data and perform calculations based on mathematical formulas.
Formulas always begin with an equal (=) sign followed by the function name (e.g., =SUM). After that, the parameters should be entered between a set of parentheses (). Follow these steps to auto-insert a Sum function each quarters sales in Excel:
- Click on the Formulastab at the top of the screen.
- You can see several icons in the toolbar at the top of the panel’s application labeled “Function Library”.
- Select the B13 cell.
- And click on the AutoSum icon in the function library.
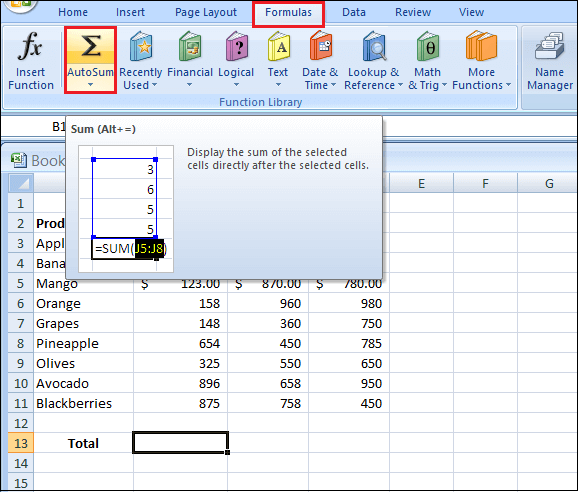
Step 12: The sum function calculates the total of each quarter.
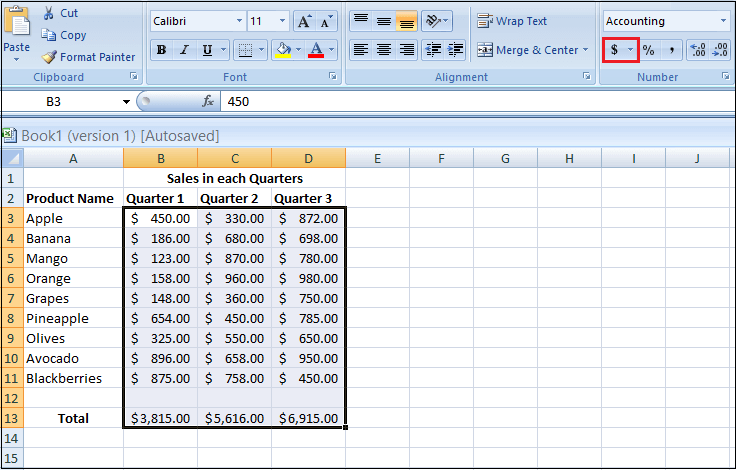
Step 13: So let’s convert the ($) currency symbol’s sales value by clicking the $ button present in the Excel ribbon.
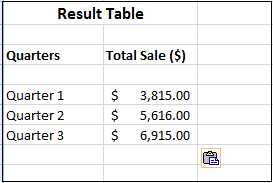
Step 14: Now create a Result Table in which have each quarter total sales of the products.
Step 15: Now plot the pie chart to represent the client’s data in a professional way that looks easy to understand.
- Select the result table.
- Click on the Insert tab in the Ribbon of Excel.
- Again click on the Pie chart icon.
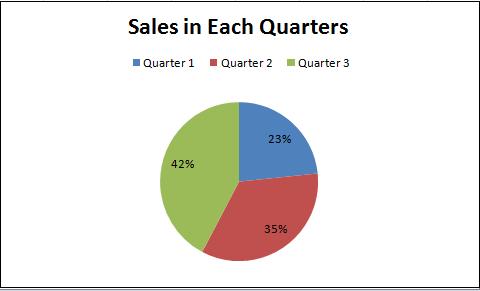
A pie chart creates a simple visualization and how the table is set up. The chart will be titled “Sales in Each Quarters”, and each dollar amount will appear as a percent of the pie chart with the necessary label.
Step 16: Save your file when you completed your report. To save the file,
- Click on the Filemenu at the top-left corner.
- And then select Save As button. Depending on your version of Excel, you will usually choose to save the file to your computer.
- Now choose the file location where you want to save your report on your computer.
- And click on the Save
This is the basic level introduction to excel Spreadsheet. Excel has a wide variety of tools to work with.


