

How To Graph A Sine Wave In Excel
To create such sine wave chart first what you need is to prepare data.
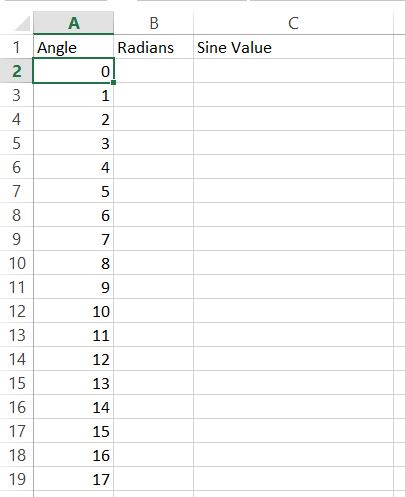
Start from writing angles from 0 to 360 degrees.
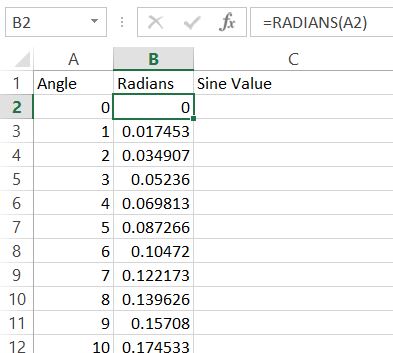
Next you need to convert degrees to radians. To do that just use =RADIANS(A2) and drag down.
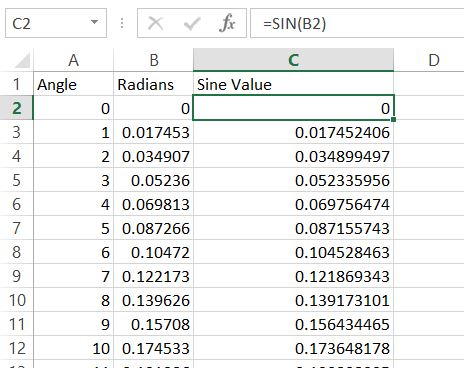
Next thing you need to do is convert radians to sine value.
Here’s the formula for you. Use Excel SIN function.
Sin formula will be =SIN(B2). Drag it down again. Base on sine values you will be able to insert sine wave plot.
Base on sine values create line chart.
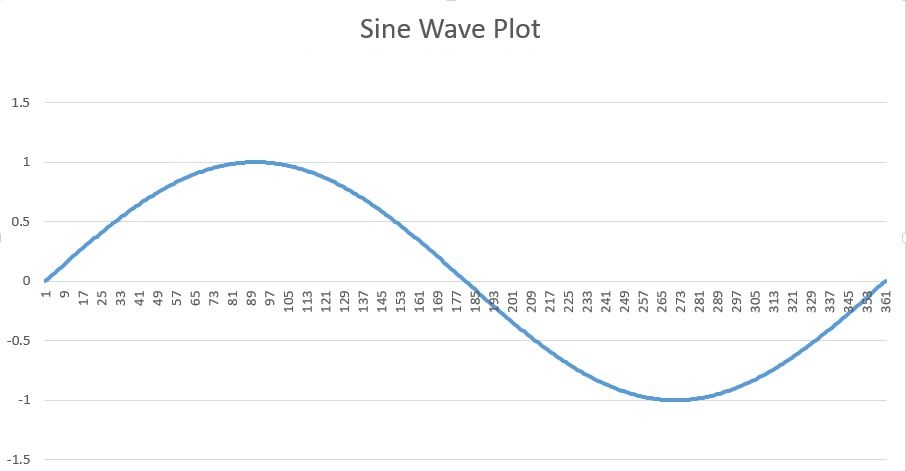
This is how your sine wave plot looks like. The wave looks nice.
Here’s where you can
Template
You can download the Template here – Download
Further reading:
Basic concepts
Getting started with Excel
Cell References


