How to Calculate the Stochastic Indicator in Excel
- C is the current closing price
- H is the highest high over the lookback period
- L is the lowest low over the lookback period
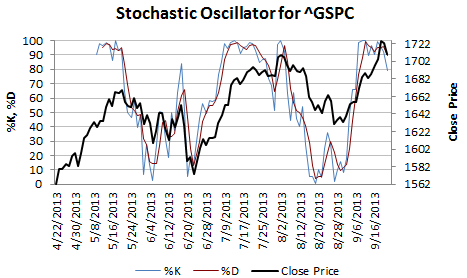
%K is plotted with another quantity, %D. %D is a simple moving average of %K over a defined smoothing period
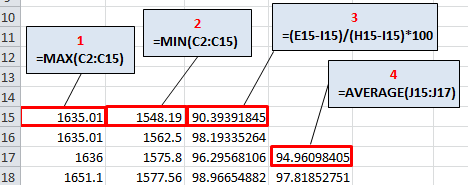
Use this formula to calculate the Stochastic Oscillator.
If your
- Date is under column A>
- Open is under column B
- High is under column C
- Low is under column D
- Close is under column E
- Then in column F
write this formula:
- =100*(E1-D1) / (C1-D1)
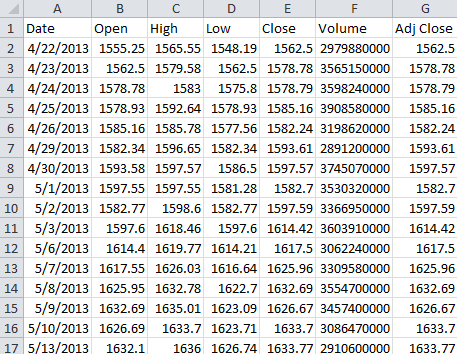
Suppose this is what your data looks like:


This is will be your final result

This is how to Calculate the Stochastic Oscillator in Excel.
Template
You can download the Template here – Download
Further reading:
Basic concepts
Getting started with Excel
Cell References


