Bar Chart
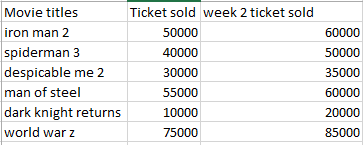
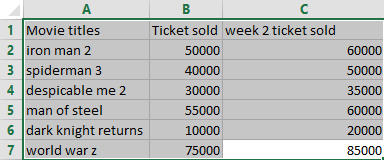
 Highlight the entire series including column titles. In this case highlight cells from A1 to C7.
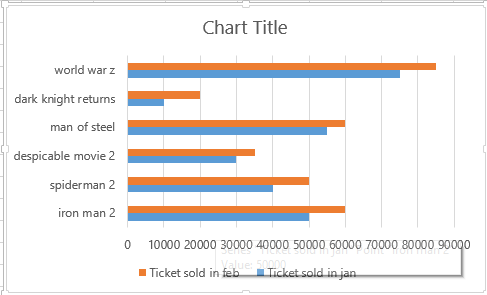
Click on the Insert tab and then click on Insert Bar Chart under Chart group and select Clustered Bar.

That’s it, you have now successfully created a bar chart.
Template
You can download the Template here – Download
Further reading:
Basic concepts
Getting started with Excel
Cell References


