Chart with confidence intervals
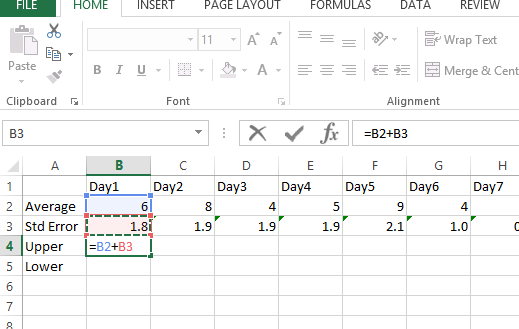
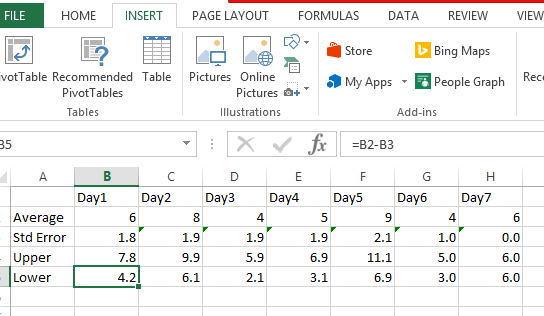
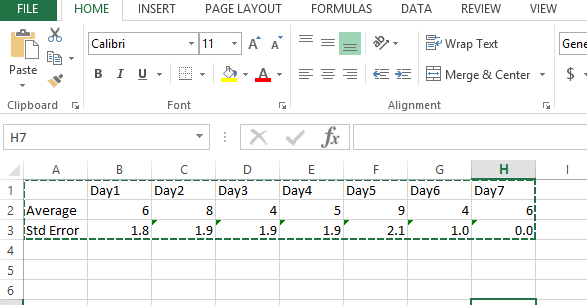 Let us calculate the differences (upper band and lower band) as follows:
Upper band formula: =B2+ B3
Lower band formula: =B2 – B3
Let us try to create the 2d chart as follows:
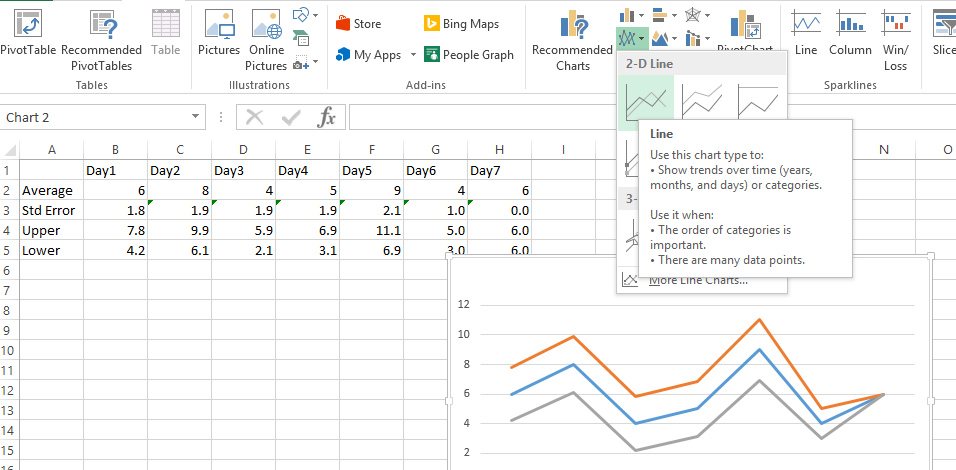
Now we have to change the chart type to an area graph:
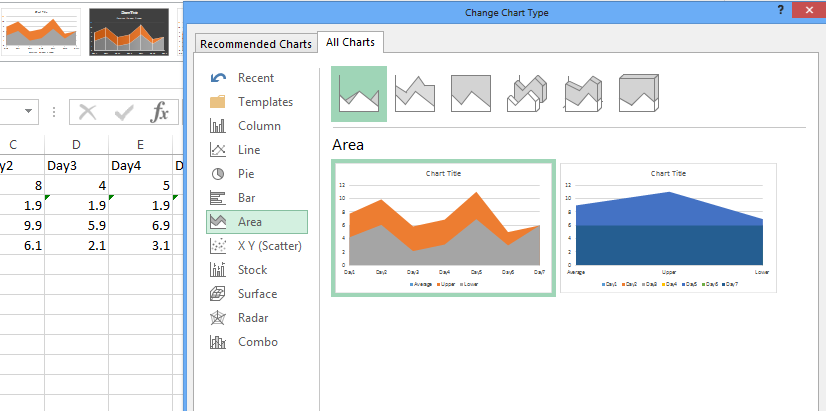
It will look like this now:
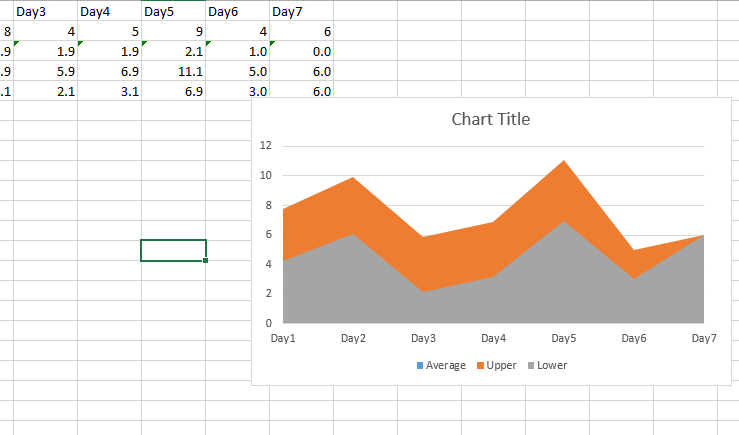
To finish the chart, simply format the upper series with a light blue fill (to match the dark blue line) and the lower series to have a white fill.

Both the confidence bar chart and the confidence band chart are in the sample worksheet here. It depends upon how you prefer it to look like.
Template
You can download the Template here – Download
Further reading:
Basic concepts
Getting started with Excel
Cell References


