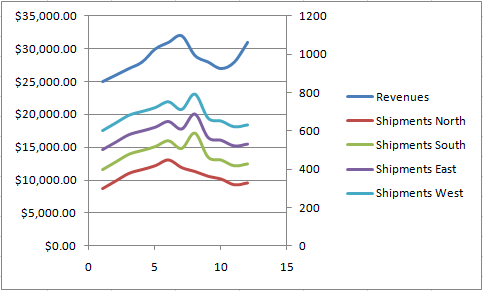
Chart with multiple series
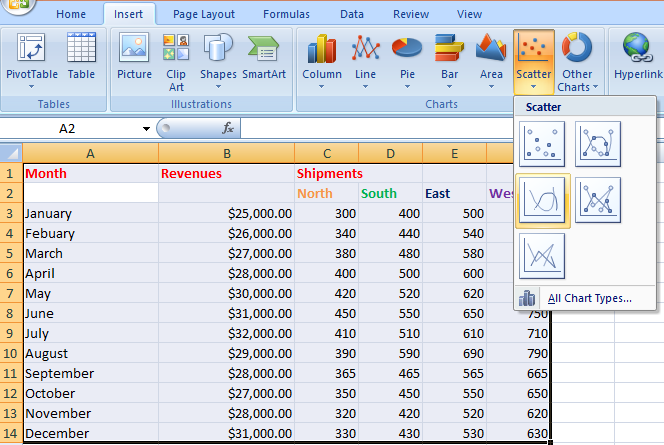
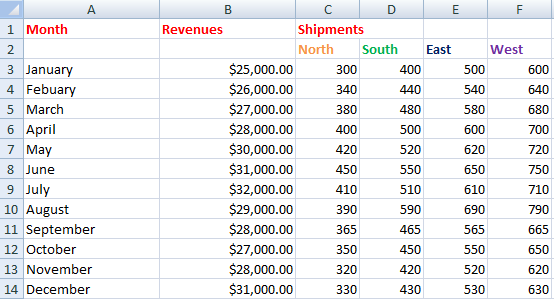 Highlight data. Go to ribbon. Under Insert option select Scatter chart with lines option.
Now you will have the chart window as shown below.
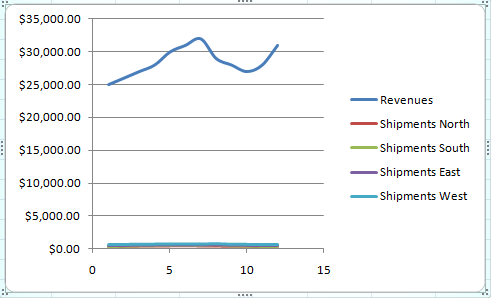
As you can see in last step all lines clotted at one place. To separate them, right click on any line and select Format Data Series option.
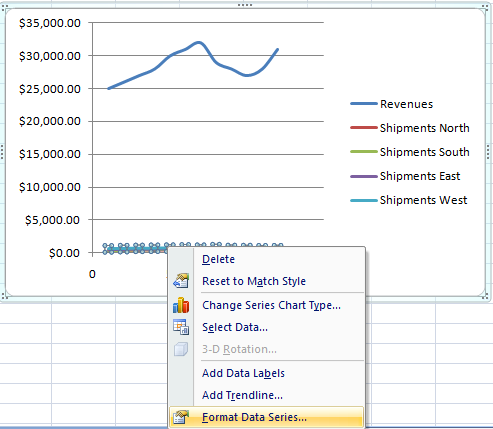
A window will appear like shown below. Select Secondary Axis.
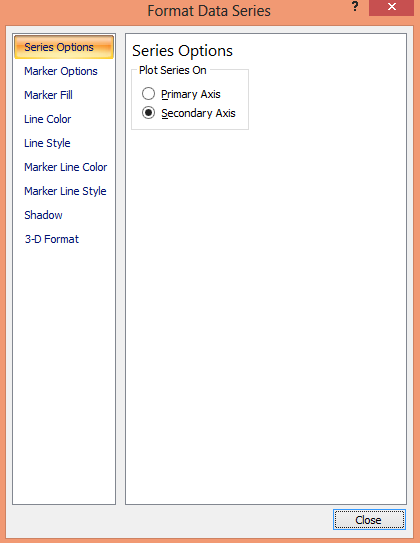
Now repeat for all the lines of data (if needed).
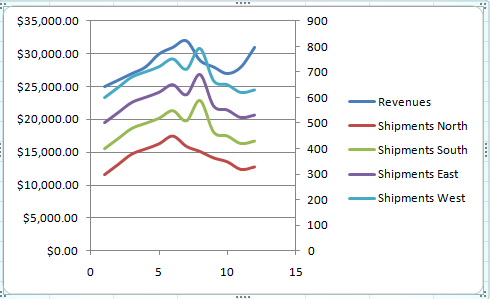
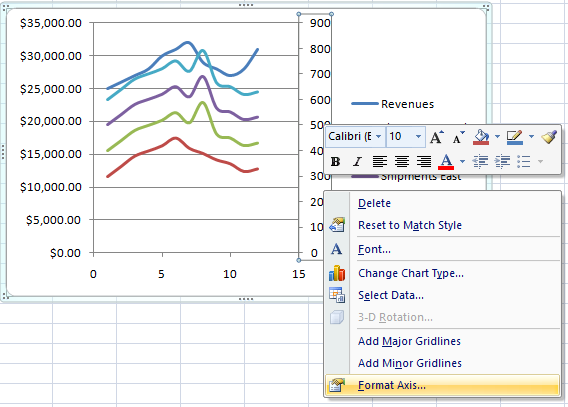
To set the axis of the chart, select the right side scale and right click and select Format Axis as shown below.
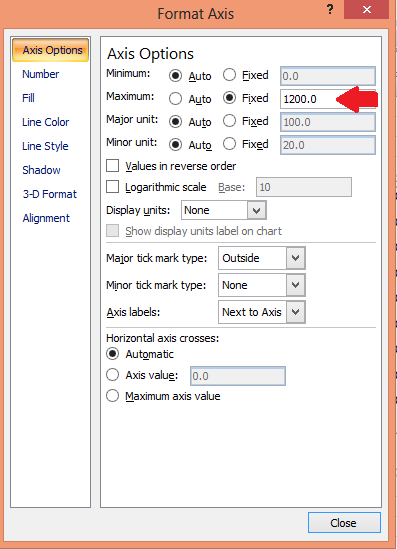
Now a window will appear like shown below. In Axis Option set the Maximum scale according to the highest value of your data.
Here you go with the chart with multiple series.
Template
You can download the Template here – Download
Further reading:
Scatter Chart
Time Series Graph
Chart with a lot of data


