Chart with subcategories

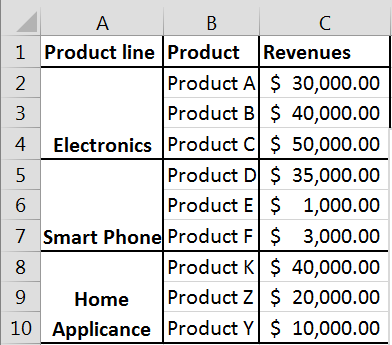
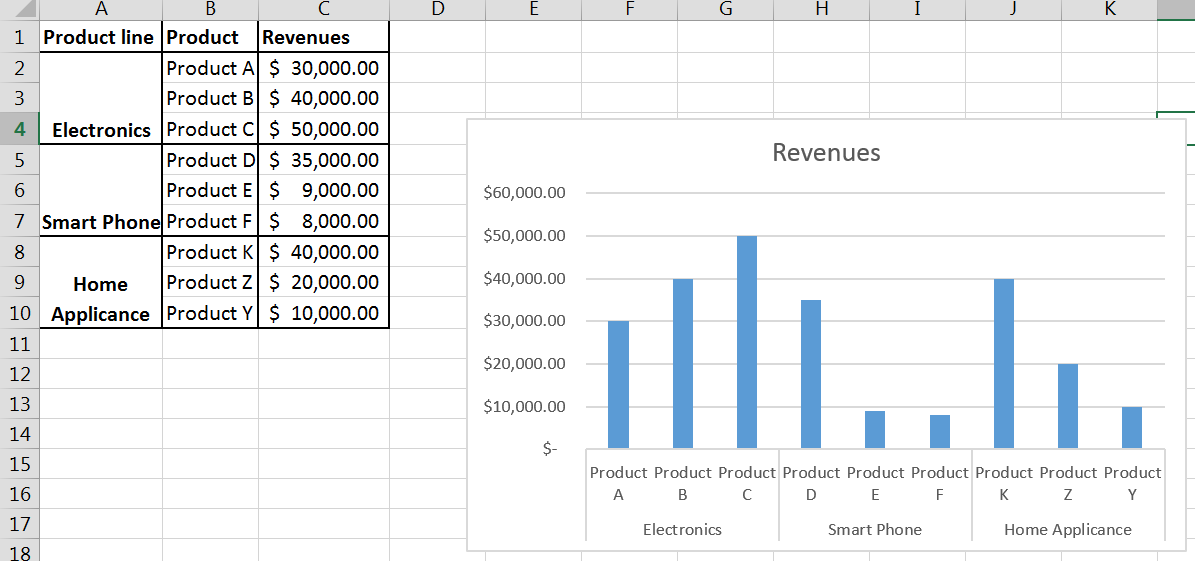
2. Now highlight the data and go to ribbon. Select insert tab and click clustered column chart.

As you see there are subcategories on the chart. Now your chart is clear and useful.
Template
You can download the Template here – Download
Further reading:
Basic concepts
Getting started with Excel
Cell References


