Chart with Checkboxes
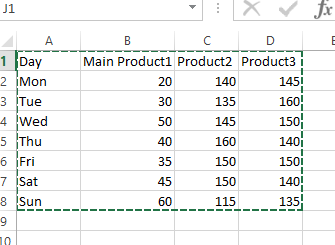 Select the data and create a chart and change chart type to combo and make product2 and product 3 as line chart with secondary axis.
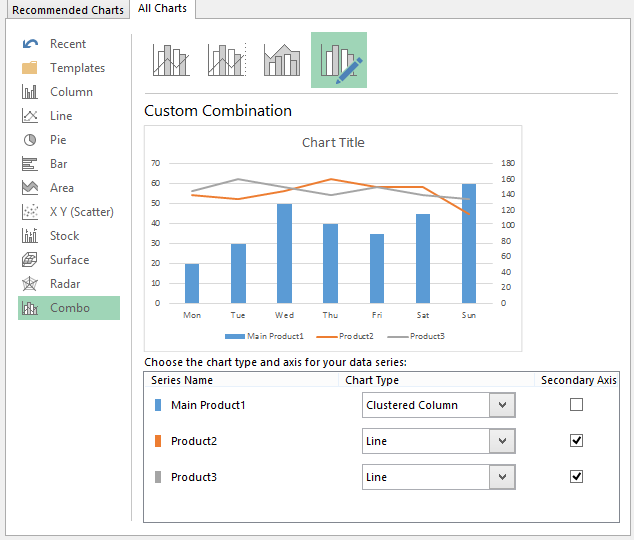
Finally the chart will look like this and product 2 and product 3 are have secondary axis on the right. As it has different values than the main product it is better to show on secondary axis. Now we will create the checkboxes to show and un-show the product2 and product 3 as these are optional.
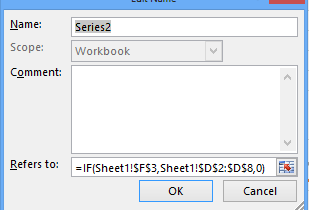
Lets define two names: series1 and series2 as follows.
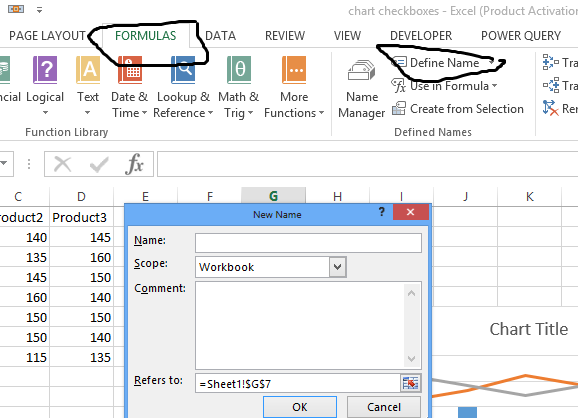
Here is how to define the first name.
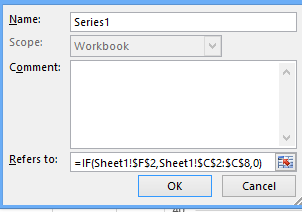
And the second one.
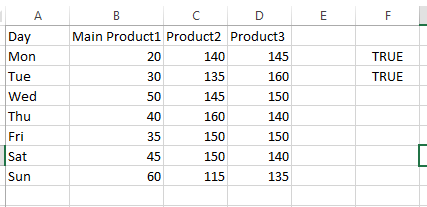
Enter values as TRUE in cells F2 and F3:
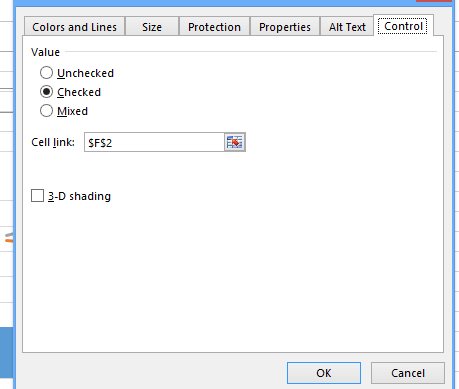
Create checkbox and format controls as follows:
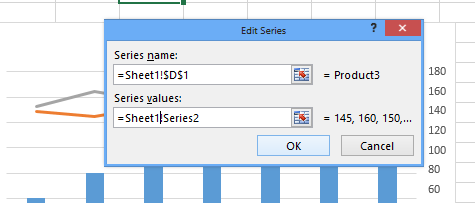
Link series to series names created:
Now with checkboxes we can remove and unremoved the product2 and product3
Template
You can download the Template here – Download


