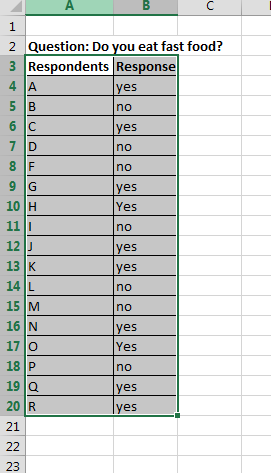
Chart with non-numeric data
 Go to Insert and click PivotChart button.
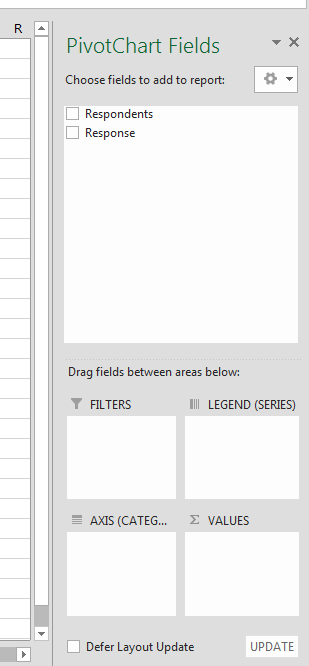
 New window pops out.
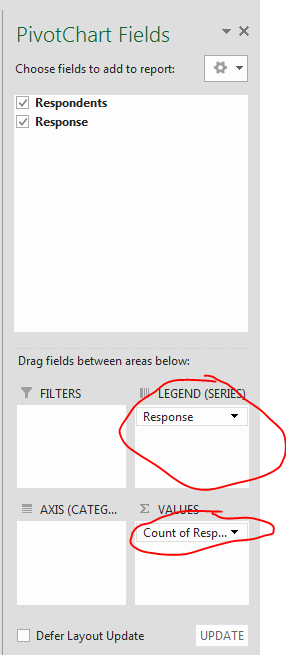
 Now drag the respondents into values and drag response into legend.
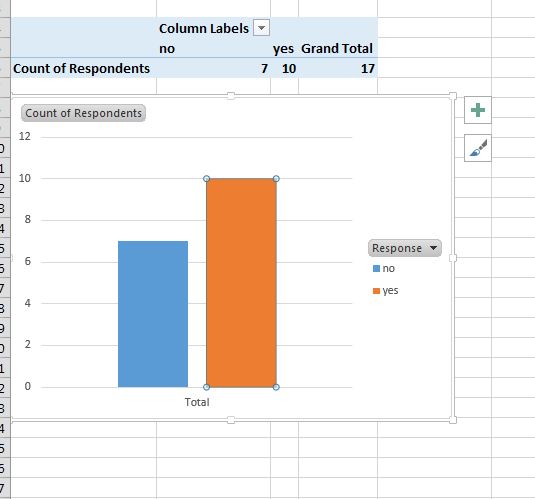
Thus, you will get the chart on your sheet.

That’s how you can insert your char with non-numeric data. You may need it for example for illustrated surveys. That’s exactly how it is also named as yes no chart.
Template
You can download the Template here – Download


