Comprehend Forecast Function with Examples
Definition of FORECAST function
The forecast function has different arguments that are all required.
X: This is essential. It is a data point, for which the user want to predict the value.
Known_y’s: This is also essential for the function. It is either a dependency array or data’s range.
Known_x’s: This is essential. An independent array that can also be data’s range.

It can looks difficult, but it is not. Let’s see some examples to explain more.
Example 1: Simple Forecast Formula
The data in this example has been layout on the table, and we need to try and predict the future value. Our business would need to predict the future, and we are using the date to acknowledge future predictions.
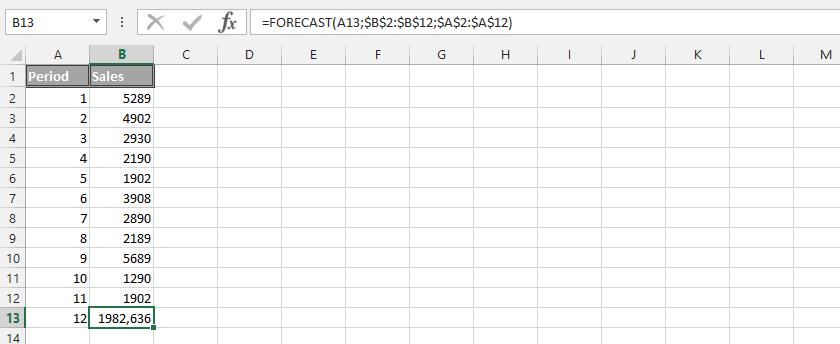
Example 2: IF and Forecast
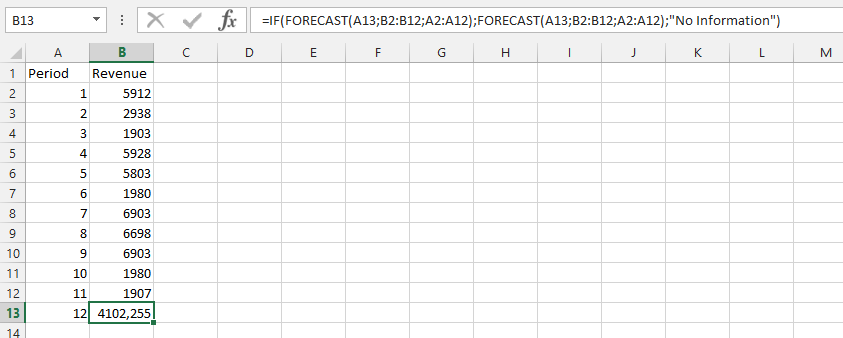
This is about using the forecast in combination with IF functions. These two will address the issues that are associating with knowing how to predict the future. This data already makes it possible, and looks like this:
Example 3: Minimum and Forecast
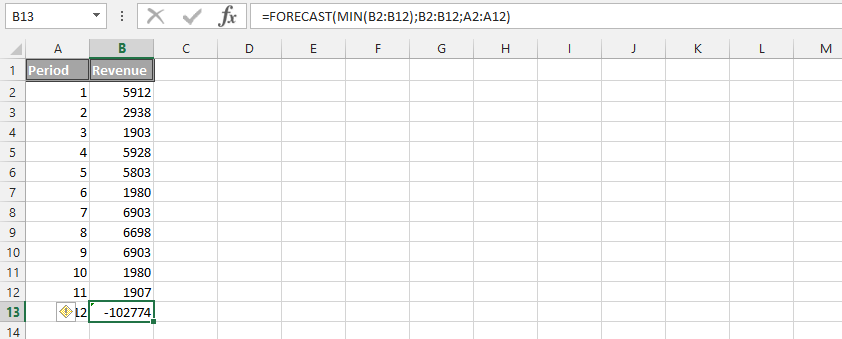
The business is booming. But, we do not want to make assumptions about the ways that the business was built. The usage of forecast in this example, is about using the minimum sales.
Example 4: Maximum and Forecast
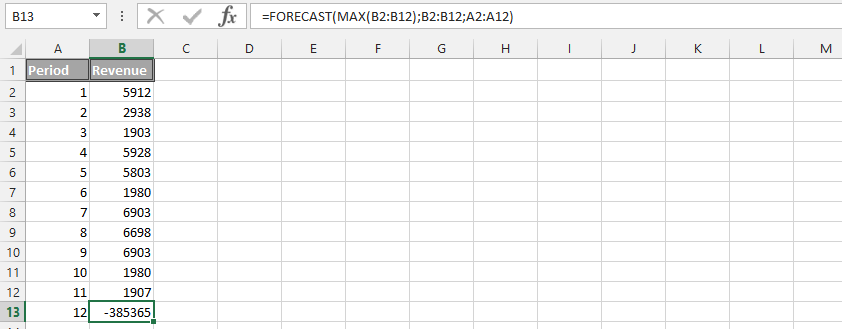
The maximum and forecast formula is combined together to get result.
Example 5: Double Forecast Formula
This example use two different forecast formulas together:
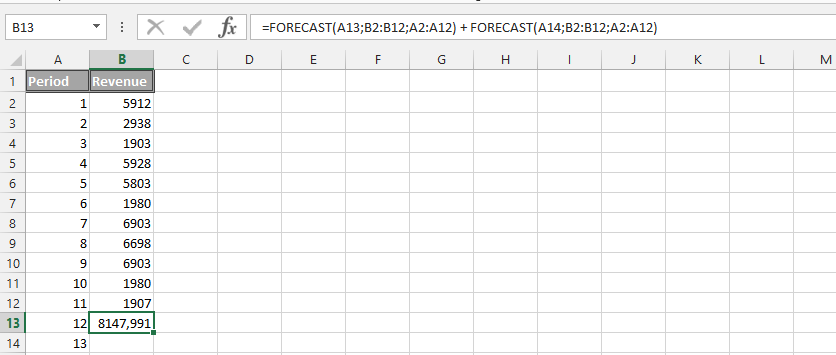
Example 6: Match and Forecast
The business is having some misunderstanding of the whole data, and we need to know that the business itself has a full comprehension. This example use both Match and Forecast functions.
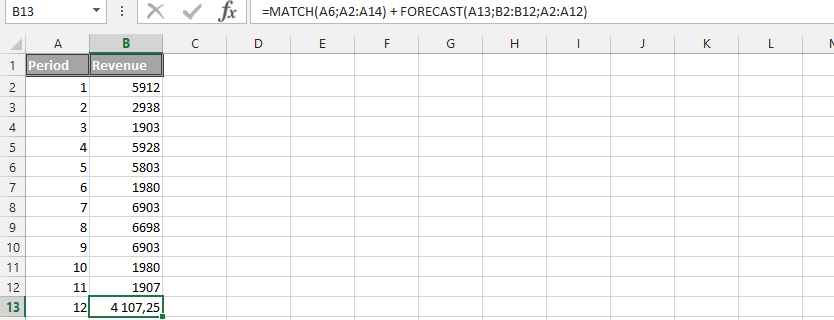
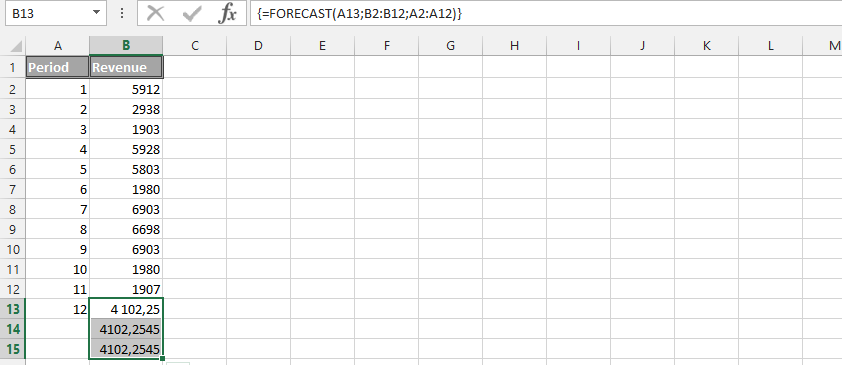
Example 7: Multiple Results
This example handle issues that explain how to use the same data, and get results for three different cells. These cells will be marked, before typing in the formula Once formula is written, then you could press the F2, followed by the CTRL (CMD on apple) + SHIFT and then press enter.
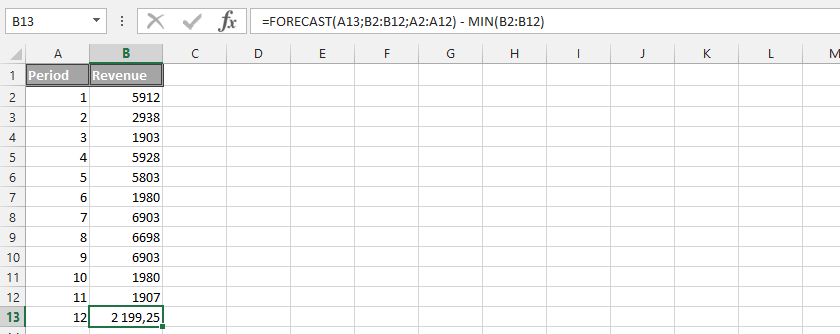
Example 8: Forecast minus Minimum
This is the formula, where we are working on a more sophisticated information. The example explains prediction of the future value, but also minus minimum of the details.
Example 9: Forecast with Text
This example is what makes it possible to predict something, especially under the circumstances that it has been layout and labeled.

Example 10: Average function and Forecast
The understanding of this situation is, we would like to use the average function in combination to the forecast function to find out the value of the prediction.

Example 11 How long students are studying to the test?
You have some historical data about test equals. You also know, how long students have studying to the test.
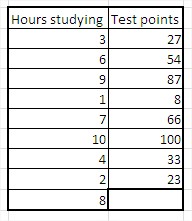
You want to calculate, how many point will get the student, who have been studying for 8 hours. You use forecast function to calculate that.
x equals 8, because you are looking for a value for 8 hors argument
known y’s are test points, which you already know
known x’s are hours studying, which you also know
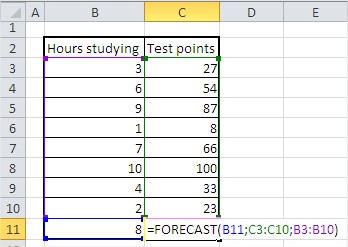
Formula in this situation is =FORECAST(B11,C3:C10,B3:B10) like on the picture below:
Forecasted value is 77.
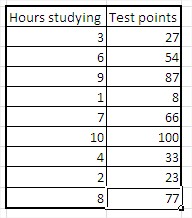
Value 77 means, that based on historical values, student will get 77 points. I hope forecast function is easy and clear. Lets do one more example.
Example 12 Forecasting net income
You have sales and net income of some company.
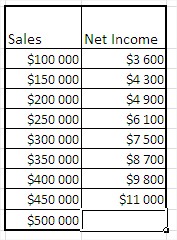
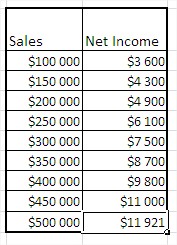
You want to calculate net income for 500 000$ sales.
x is 500 000$
known y’s is historical net income
known x’s is historical sales
Formula here is =FORECAST(B11,C3:C10,B3:B10)
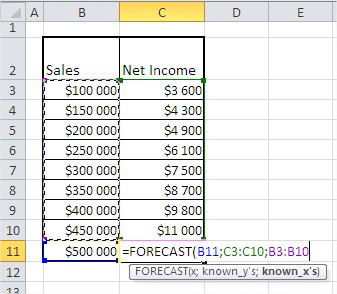
Net income equals 11921 $.
Example 13 Dates forecasting
You can also forecast dates. Here’s an example.
In this table you have data of sales in the end of each month. You want to know where you will have 1 000 000 $ of sales.
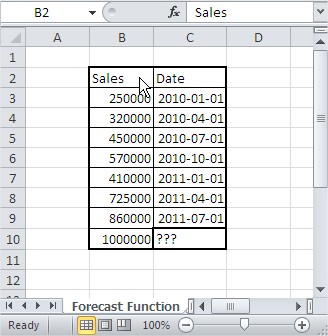
x is 1 000 000$
known y’s is historical dates
known x’s is historical sales
Formula is: =FORECAST(B10;C3:C9;B3:B9)
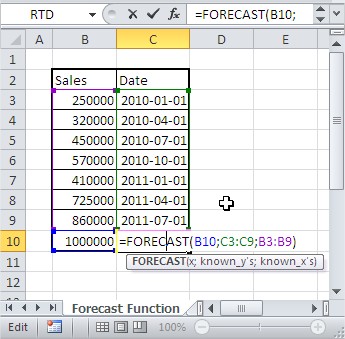
Formatting of cells is General by default so your result is not a date.
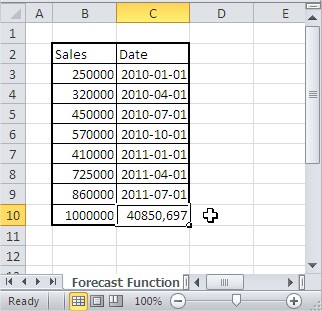
Change formatting of the cell. Click right and next Format Cells… and change formatting to Date.
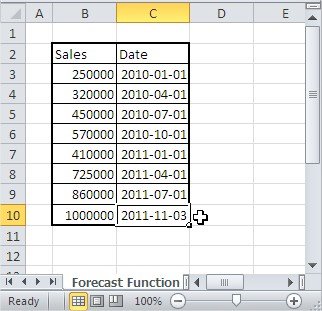
Result is 2011-11-03. Excel predicts that your company will have 1 million USD sales at that day.
There are some basic examples. Of course there are also many ways to use forecast function for business. Forecast function is easy to use and really powerful.
Tip in case of errors:
If the x argument is nonnumeric, FORECAST function returns the #VALUE! error.
If known_y’s and known_x’s are empty or contain a different number of data points, FORECAST function returns the #N/A error.
If the variance of known_x argument is zero, the function FORECAST returns the #DIV/0! error.
Template
Further reading:
Basic concepts
Getting started with Excel
Cell References


